Disclaimer
All information shown on this page is for illustrative purposes only and should not be construed as investment, financial, market or other advice. Any information shown on this page that purports to be based upon past or current market conditions may not be complete, timely or accurate and, in any event, is not predictive of future outcomes.
Report This Indicator
(Gamma Levels)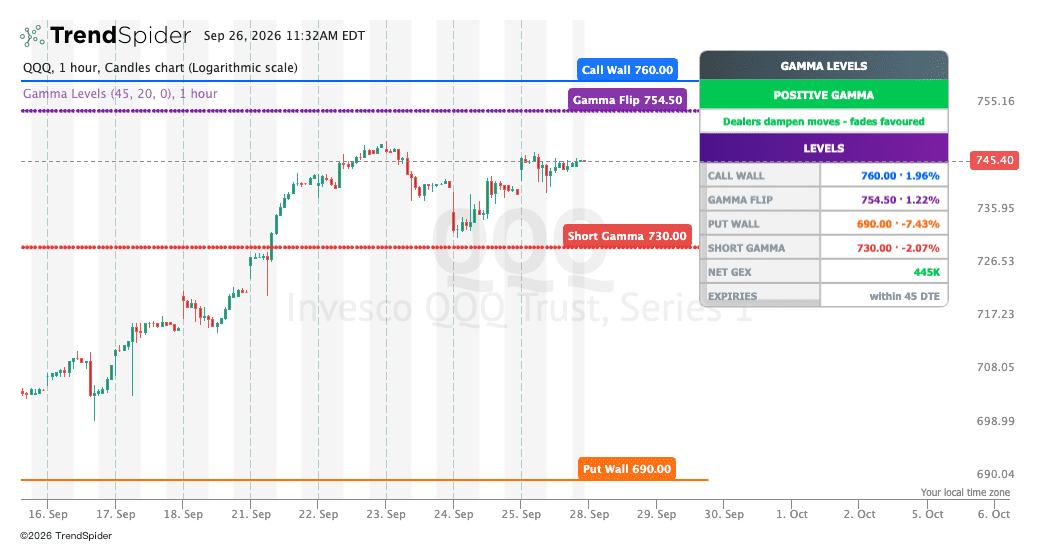
Gamma Flip & Option Walls — Institutional Flow Levels (GEX)
Four levels that define the field: where the crowd sits, and where dealer gamma turns.
Most gamma tools give you one number. Gamma Levels gives you the four boundaries that shape how price behaves — two built from where option contracts actually sit, two from where gamma exposure changes character.
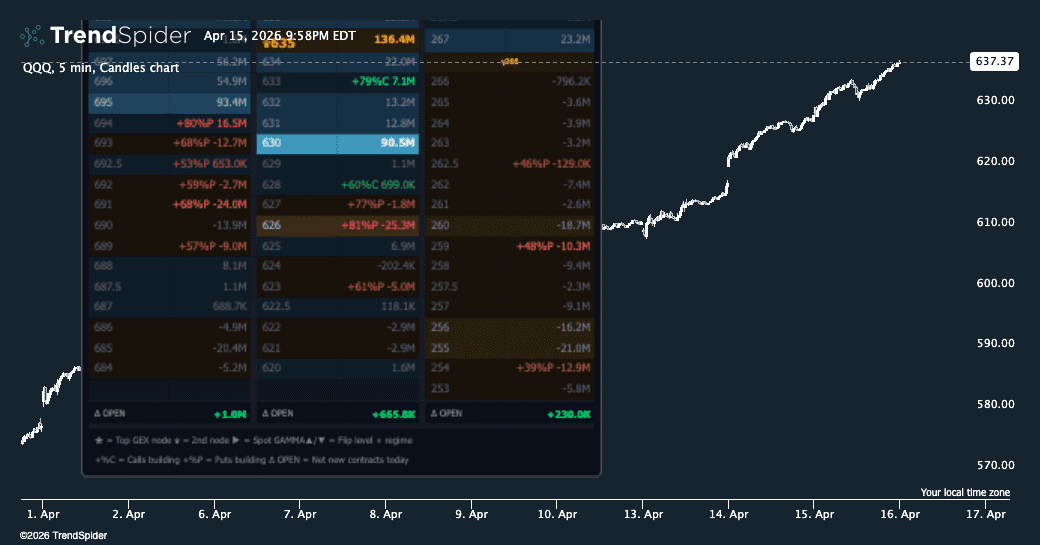
📺 Video tutorial (3.5 min) — how to read Gamma Levels on a real QQQ chart. It covers the panel, the walls, and how to plan a key level both ways (bounce or break): https://youtu.be/lsp5216OqBU
What it plots
🔵 Call Wall — the strike holding the most call open interest. This is where the crowd is positioned, and where price often stalls as it approaches.
🟠 Put Wall — the strike holding the most put open interest. The downside equivalent, and frequently a floor.
🟣 Gamma Flip — the level where cumulative dealer gamma crosses zero, taking the crossing nearest price. Above it, hedging tends to absorb moves; below it, hedging tends to push them further. When no crossing exists in range, the panel says so rather than drawing a line.
🔴 Short Gamma — the strike carrying the most negative gamma exposure. The point of maximum instability, where hedging amplifies rather than dampens.
The panel states whether the market is in positive or negative gamma overall, lists each level with its distance from price, and shows net exposure.
Why open-interest walls matter
The call and put walls are built from open interest, not gamma. That's deliberate. Gamma tells you where hedging pressure is strongest right now; open interest tells you where the most contracts are actually parked — the levels that matter into expiration and where positioning is most crowded. The two often sit at different strikes, and knowing both is more useful than knowing either alone.
How to use it
Treat the walls as the range. Price tends to travel between the put wall and the call wall, and pushes through them only with real conviction behind it.
Use the flip to know which environment you're in. Above it, expect chop and mean reversion. Below it, and especially near the short gamma level, expect acceleration.
Watch the spacing. Walls close together mean a tight, well-defended range. Walls far apart mean room to run once price gets moving.
Set an alert on the gamma flip instead of watching for it — crossing above or below it is a registered signal.
Best on liquid names with real open interest. On thin chains the levels are noise. The expiry window is adjustable; by default it uses everything within 45 days.
Built for traders who want the structural boundaries — crowd positioning and gamma regime — without interpreting a full chain.
Want the read as well as the levels? Winvest Gamma Suite adds gamma-weighted walls, the expected move band, and a regime score that tells you whether the structure favours buying options or selling premium — all on one chart with individual toggles.
📈 Watch me trade — live 30-minute setups on StockTwits with the Multi-Target Options Trade Plan Pro: stocktwits.com/winvestinsights
📬 Free weekly newsletter — market structure, options flow, and the longer-term positions I'm building: winvest-insights.beehiiv.com
For educational purposes only. Not financial advice.
Traders also viewed