Disclaimer
All information shown on this page is for illustrative purposes only and should not be construed as investment, financial, market or other advice. Any information shown on this page that purports to be based upon past or current market conditions may not be complete, timely or accurate and, in any event, is not predictive of future outcomes.
Report This Indicator
(Expected Options Move (Daily, Weekly, Monthly))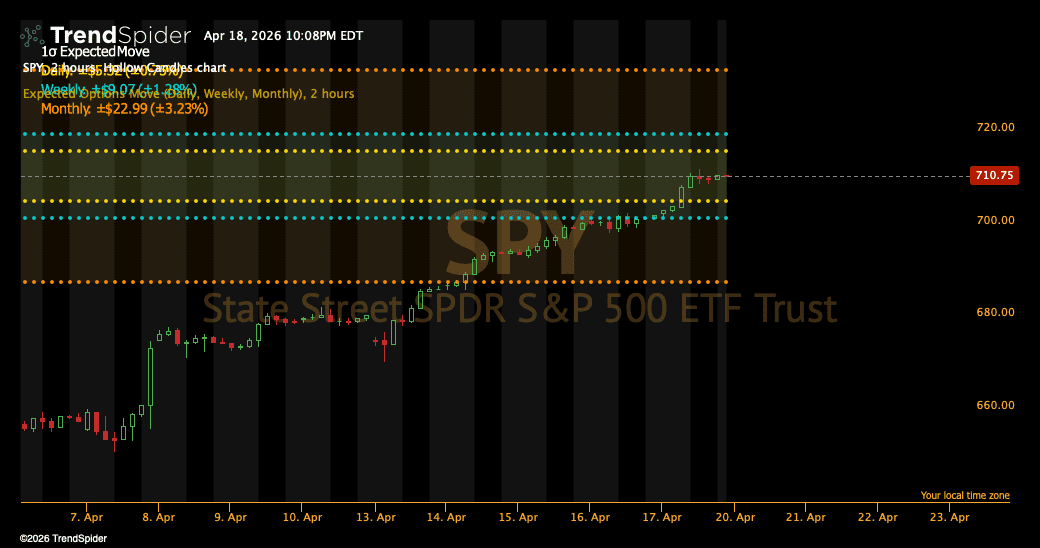
Expected Options Move (Daily, Weekly, Monthly)
See exactly what the options market is pricing in — across three time horizons, live on your chart.
This indicator pulls real-time options data to calculate the 1-sigma expected move for the nearest Daily, Weekly, and Monthly expirations. Upper and lower bands are plotted as horizontal lines with a shaded fill zone, giving you an instant visual read on where the options market expects price to stay with roughly 68% probability.
Two Band Modes
Symmetric (default) — Bands are calculated from the ATM straddle price, scaled by a configurable multiplier (default 0.85). A clean, fast read on market-implied range.
Asymmetric (16-delta) — Bands are placed directly at the 16-delta call and put strikes rather than equal distances from the current price. Because the options market almost always prices in more downside than upside risk (put skew), this mode shows the true market-implied range rather than a symmetric approximation. When asymmetric mode is active, the legend updates to show separate upside and downside moves so the skew is immediately visible.
Both modes fall back to an IV-based calculation (S × IV × √(DTE/365)) when ATM bid/ask spreads are too wide to trust the straddle price.
What You Get
- Three bands plotted simultaneously — Daily (≤2 DTE), Weekly (4–10 DTE), and Monthly (20–50 DTE)
- Show/hide toggle for each band independently via checkboxes
- Fully customizable colors for each band
- Per-band line style — solid or dotted, set independently for each horizon
- Adjustable line thickness and fill opacity
- Live legend showing dollar and percentage moves for each horizon; updates automatically to asymmetric format when 16-delta mode is on
- *`
marker** when the IV fallback is in use; **†` marker** if delta data is unavailable and symmetric EM is used as fallback in asymmetric mode - Y-axis scaling protection — band lines never push the chart's auto-scale range
Inputs
| Input | Default | Description |
|---|---|---|
| Show Daily / Weekly / Monthly Band | true | Toggle each band on or off |
| Daily / Weekly / Monthly Band Color | Gold / Teal / Orange | Color for each band |
| Daily / Weekly / Monthly Line Style | dotted / dotted / line | Line style for each band |
| Line Thickness | 2 | Width of band lines in pixels |
| Fill Opacity | 0.08 | Transparency of the shaded fill zone |
| Asymmetric Bands (16-delta) | false | Use 16-delta strikes instead of symmetric EM |
| Daily Max DTE | 2 | Max DTE for daily expiration selection |
| Weekly Min / Max DTE | 4 / 10 | DTE window for weekly expiration |
| Monthly Min / Max DTE | 20 / 50 | DTE window for monthly expiration |
| EM Multiplier | 0.85 | Scales straddle price to expected move (symmetric mode) |
| IV Fallback Spread | 0.20 | Relative spread threshold that triggers IV-based fallback |
Notes
- Requires a TrendSpider plan with live options data access
- Compatible with equities and ETFs that have listed options chains
- Not supported on futures contracts (options data unavailable)
- All three expirations are fetched in parallel for fast load times
describe_indicator('Expected Options Move (Daily, Weekly, Monthly)');
// 1-sigma expected moves from ATM straddles across three horizons.
// Symmetric mode: EM ≈ straddle × multiplier (default 0.85; theory ~0.7979).
// Asymmetric mode: upper/lower bands from the 16-delta call/put strikes.
// Falls back to IV-based EM = S × IV × √(DTE/365) when ATM spreads are wide.

// ---------- Band visibility ----------
const showDailyBand   = input.boolean('Show Daily Band',   true);
const showWeeklyBand  = input.boolean('Show Weekly Band',  true);
const showMonthlyBand = input.boolean('Show Monthly Band', true);

// ---------- Colors ----------
const dailyBandColor   = input.color('Daily Band Color',   '#FFD700');
const weeklyBandColor  = input.color('Weekly Band Color',  '#00CED1');
const monthlyBandColor = input.color('Monthly Band Color', '#FF8C00');

// ---------- Line style & weight ----------
const dailyLineStyle   = input.select('Daily Line Style',   'dotted', ['line', 'dotted']);
const weeklyLineStyle  = input.select('Weekly Line Style',  'dotted', ['line', 'dotted']);
const monthlyLineStyle = input.select('Monthly Line Style', 'line',   ['line', 'dotted']);
const lineThickness    = input('Line Thickness', 2);
const fillOpacity      = input('Fill Opacity',   0.08);

// ---------- DTE windows ----------
const dailyMaxDte   = input('Daily Max DTE',    2);
const weeklyMinDte  = input('Weekly Min DTE',   4);
const weeklyMaxDte  = input('Weekly Max DTE',   10);
const monthlyMinDte = input('Monthly Min DTE',  20);
const monthlyMaxDte = input('Monthly Max DTE',  50);

// ---------- Calculation settings ----------
const useAsymmetric    = input.boolean('Asymmetric Bands (16-delta)', false);
const straddleMult     = input('EM Multiplier',       0.85);
const wideSpreadCutoff = input('IV Fallback Spread',  0.20); // 20%

// ---------- Fetch schedule ----------
const schedule = await request.options_schedule(current.ticker);
assert(schedule && !schedule.error, `Error fetching options schedule: ${schedule?.error || 'Unknown error'}`);

const sortedSchedule = [...schedule].sort((a, b) => a.expiration.dte - b.expiration.dte);

const findExpiration = (minDte, maxDte) => {
	for (const exp of sortedSchedule) {
		const dte = exp.expiration.dte;
		if (dte >= minDte && dte <= maxDte) return exp;
	}
	return null;
};

// ---------- Safe bid/ask midpoint ----------
const mid = (q) => {
	if (!q) return null;
	if (q.l && q.l > 0) return q.l;
	if (q.b > 0 && q.a > 0) return (q.b + q.a) / 2;
	if (q.b > 0) return q.b;
	if (q.a > 0) return q.a;
	return null;
};

// Relative bid-ask spread; returns 1 (100%) when unknown so it trips the IV fallback
const relSpread = (q) => {
	if (!q || !(q.b > 0) || !(q.a > 0)) return 1;
	const m = (q.a + q.b) / 2;
	return m > 0 ? (q.a - q.b) / m : 1;
};

// ---------- Expected-move computation ----------
const computeExpectedMove = async (expiration) => {
	if (!expiration) return null;
	const optionsData = await request.options_data_for_expiration(
		current.ticker,
		expiration.expiration.code,
		['l', 'b', 'a', 'iv', 'gd']  // gd = delta
	);
	if (!optionsData?.resultByStrike) return null;

	const currentPrice = optionsData.underlyingSymbolQuote.lastPrice;
	const strikes = Object.keys(optionsData.resultByStrike).map(Number).sort((x, y) => x - y);
	if (strikes.length === 0) return null;

	// ---------- ATM straddle ----------
	let lowerIdx = 0;
	for (let i = 0; i < strikes.length; i++) {
		if (strikes[i] <= currentPrice) lowerIdx = i; else break;
	}
	const upperIdx  = Math.min(lowerIdx + 1, strikes.length - 1);
	const lowStrike = strikes[lowerIdx];
	const highStrike = strikes[upperIdx];

	const quoteAt = (strike) => {
		const d = optionsData.resultByStrike[strike];
		const c = mid(d?.C);
		const p = mid(d?.P);
		if (!c || !p || c <= 0 || p <= 0) return null;
		return {
			call: c,
			put:  p,
			iv:   (d?.C?.iv ?? d?.P?.iv) ?? null,
			callSpread: relSpread(d?.C),
			putSpread:  relSpread(d?.P),
		};
	};

	// NOTE: `low`, `high`, `open`, `close`, `volume` are reserved TrendSpider globals.
	const lowQ  = quoteAt(lowStrike);
	const highQ = quoteAt(highStrike);
	if (!lowQ && !highQ) return null;

	let callPrice, putPrice, iv, worstSpread;
	if (lowQ && highQ && lowStrike !== highStrike) {
		const t   = (currentPrice - lowStrike) / (highStrike - lowStrike);
		callPrice   = lowQ.call + t * (highQ.call - lowQ.call);
		putPrice    = lowQ.put  + t * (highQ.put  - lowQ.put);
		iv          = (lowQ.iv != null && highQ.iv != null)
			? lowQ.iv + t * (highQ.iv - lowQ.iv)
			: (lowQ.iv ?? highQ.iv);
		worstSpread = Math.max(lowQ.callSpread, lowQ.putSpread, highQ.callSpread, highQ.putSpread);
	} else {
		const d   = lowQ || highQ;
		callPrice   = d.call;
		putPrice    = d.put;
		iv          = d.iv;
		worstSpread = Math.max(d.callSpread, d.putSpread);
	}

	const straddle   = callPrice + putPrice;
	const emStraddle = straddle * straddleMult;
	const dte  = expiration.expiration.dte;
	const emIv = (iv && iv > 0 && dte > 0) ? currentPrice * iv * Math.sqrt(dte / 365) : null;

	const useIv       = (worstSpread > wideSpreadCutoff) && emIv;
	const expectedMove = useIv ? emIv : emStraddle;
	const source       = useIv ? 'IV' : 'straddle';

	// ---------- Asymmetric 16-delta strikes ----------
	// delta ('gd') may be on a 0-1 or 0-100 scale depending on data source;
	// normalise to 0-1 by checking magnitude.
	let upperStrike = null, lowerStrike = null;
	let bestCallDiff = Infinity, bestPutDiff = Infinity;

	for (const strike of strikes) {
		const d = optionsData.resultByStrike[strike];

		// Call: target delta ≈ +0.16 (1σ up)
		if (d?.C?.gd != null) {
			const raw  = d.C.gd;
			const norm = Math.abs(raw) > 1 ? raw / 100 : raw;
			const diff = Math.abs(norm - 0.16);
			if (diff < bestCallDiff) { bestCallDiff = diff; upperStrike = strike; }
		}

		// Put: target delta ≈ -0.16 (1σ down)
		if (d?.P?.gd != null) {
			const raw  = d.P.gd;
			const norm = Math.abs(raw) > 1 ? raw / 100 : raw;
			const diff = Math.abs(norm + 0.16); // put delta is negative, so norm ≈ -0.16
			if (diff < bestPutDiff)  { bestPutDiff  = diff; lowerStrike = strike; }
		}
	}

	return { expectedMove, currentPrice, dte, source, emStraddle, emIv, upperStrike, lowerStrike };
};

// ---------- Parallel fetch ----------
const dailyExp   = findExpiration(0,            dailyMaxDte);
const weeklyExp  = findExpiration(weeklyMinDte,  weeklyMaxDte);
const monthlyExp = findExpiration(monthlyMinDte, monthlyMaxDte);

const [dailyMove, weeklyMove, monthlyMove] = await Promise.all([
	computeExpectedMove(dailyExp),
	computeExpectedMove(weeklyExp),
	computeExpectedMove(monthlyExp),
]);

// ---------- Unified anchor (live price preferred over last close) ----------
const anchor = monthlyMove?.currentPrice
	?? weeklyMove?.currentPrice
	?? dailyMove?.currentPrice
	?? close[close.length - 1];

// ---------- Paint bands ----------
// paint() must always be called the same number of times per indicator run.
// We use constants.empty_series + hidden:true rather than early-returning,
// so the call count stays constant regardless of data availability or show toggles.
const paintBand = (move, label, color, style, show) => {
	const noData = !move;

	// Determine band price levels
	let upperPrice, lowerPrice;
	if (!noData) {
		if (useAsymmetric && move.upperStrike != null && move.lowerStrike != null) {
			upperPrice = move.upperStrike;
			lowerPrice = move.lowerStrike;
		} else {
			upperPrice = anchor + move.expectedMove;
			lowerPrice = anchor - move.expectedMove;
		}
	}

	const upperSeries = noData ? constants.empty_series : horizontal_line(upperPrice);
	const lowerSeries = noData ? constants.empty_series : horizontal_line(lowerPrice);
	const isHidden    = noData || !show;

	const u = paint(upperSeries, {
		name:               `${label} Upper`,
		color:              series_of(color),
		style,
		thickness:          lineThickness,
		hidden:             isHidden,
		ignoreWhenScaling:  true,
	});
	const l = paint(lowerSeries, {
		name:               `${label} Lower`,
		color:              series_of(color),
		style,
		thickness:          lineThickness,
		hidden:             isHidden,
		ignoreWhenScaling:  true,
	});

	// fill() is not subject to the same constant-call-count rule as paint()
	if (!isHidden) fill(u, l, color, fillOpacity);
};

paintBand(dailyMove,   'Daily',   dailyBandColor,   dailyLineStyle,   showDailyBand);
paintBand(weeklyMove,  'Weekly',  weeklyBandColor,  weeklyLineStyle,  showWeeklyBand);
paintBand(monthlyMove, 'Monthly', monthlyBandColor, monthlyLineStyle, showMonthlyBand);

// ---------- Legend ----------
const fmtRow = (label, move, color) => {
	if (!move) return { cells: [{ text: `${label} N/A`, color: '#666666' }] };

	let text;
	if (useAsymmetric && move.upperStrike != null && move.lowerStrike != null) {
		const upMove  = move.upperStrike - move.currentPrice;
		const dnMove  = move.currentPrice - move.lowerStrike;
		const upPct   = (upMove / move.currentPrice) * 100;
		const dnPct   = (dnMove / move.currentPrice) * 100;
		const tag     = move.source === 'IV' ? ' *' : '';
		text = `${label} +$${upMove.toFixed(2)} / -$${dnMove.toFixed(2)} (+${upPct.toFixed(1)}% / -${dnPct.toFixed(1)}%)${tag}`;
	} else {
		const pct = (move.expectedMove / move.currentPrice) * 100;
		const tag = move.source === 'IV' ? ' *' : '';
		text = `${label} ±$${move.expectedMove.toFixed(2)} (±${pct.toFixed(2)}%)${tag}`;
	}

	return { cells: [{ text, color }] };
};

const legendRows = [
	{ cells: [{ text: useAsymmetric ? '1σ Expected Move (asymmetric)' : '1σ Expected Move', color: 'white' }] },
	fmtRow('Daily:  ', dailyMove,   dailyBandColor),
	fmtRow('Weekly: ', weeklyMove,  weeklyBandColor),
	fmtRow('Monthly:', monthlyMove, monthlyBandColor),
];

if ([dailyMove, weeklyMove, monthlyMove].some(m => m?.source === 'IV')) {
	legendRows.push({ cells: [{ text: '* IV-based (wide spread)', color: '#888888' }] });
}
if (useAsymmetric && [dailyMove, weeklyMove, monthlyMove].some(
	m => m && (m.upperStrike == null || m.lowerStrike == null)
)) {
	legendRows.push({ cells: [{ text: '† delta unavailable, using symmetric EM', color: '#888888' }] });
}

paint_overlay('ExpectedMoveLegend', { position: 'top_right', offset_x: 60, offset_y: 20 }, {
	rows: legendRows
});Traders also viewed