

Dark Cloud Cover Candlestick Pattern: Bearish Reversal Pattern & Market Psychology
The Dark Cloud Cover is one of the most important two-candle bearish reversal patterns in technical analysis. Traders use it to spot early signs of trend exhaustion after a strong upward move. While the formation is visually simple, it represents a significant psychological shift between buyers and sellers, making it a powerful indication of potential reversal.
The pattern is well-documented in classical candlestick analysis, including the work of Steve Nison, who helped popularize Japanese candlestick charting in Western markets. Today, the Dark Cloud Cover remains widely used across equities, futures, commodities, forex, and cryptocurrency markets. Despite modern market volatility and algorithmic trading, the core psychology behind the pattern remains highly relevant.
For traders of all levels, understanding the Dark Cloud Cover pattern helps improve market timing, anticipate momentum shifts, and manage risk more effectively.

Key Takeaways
- The Dark Cloud Cover is a two-candle bearish reversal pattern that forms after an uptrend.
- The second candle opens above the previous high (gap-up) but closes below the midpoint of the first candle.
- The pattern signals a momentum shift from bullish control to growing selling pressure.
- Confirmation is essential. Traders typically wait for another bearish candle or a support-level breakdown.
- The pattern is most reliable when it forms near resistance or after an extended rally.
- Works across markets including stocks, futures, forex (gap equivalents), and crypto.
- Should always be used alongside other technical tools, not in isolation.
What Is the Dark Cloud Cover?
The Dark Cloud Cover is a bearish reversal candlestick pattern that consists of two candles forming during an uptrend. This pattern indicates that buyers initially push prices higher, but sellers take over strongly enough to pull the closing price below the midpoint of the previous bullish candle.
Core Characteristics:
- Candle 1: Strong bullish candle
- Candle 2: Bearish candle that gaps up but closes below the midpoint
- Must occur after a clear uptrend
- Represents rejection and potential reversal
The deeper the second candle closes into the first candle’s body, the stronger the bearish signal.
Formation of the Dark Cloud Cover Pattern
To properly identify the pattern, traders look for specific structural requirements.
1. Prior Uptrend
The pattern has no meaning unless it forms after a sustained rally or upward momentum.
2. First Candle: Bullish
- Large real body
- Indicates strong buyer conviction
- Establishes the upward sentiment
3. Second Candle: Bearish Reversal
The second candle must meet these conditions:
- Opens above the previous candle’s high (gap-up)
- Closes below the midpoint of the previous candle
- Has a bearish body
A close that barely reaches the midpoint is weaker. A close far below it strengthens the signal.
Additional Factors That Strengthen the Pattern:
- High trading volume on the reversal candle
- Upper wick showing strong rejection
- Occurring near resistance zones, supply levels, or round numbers
- Forming after a sharp or extended rally
Market Psychology Behind the Pattern
Understanding the psychology behind the pattern is crucial for interpreting its significance.
Phase 1: Bullish Momentum: The first candle shows strong buying interest, confirming the continuation of the uptrend.
Phase 2: Over-Optimism and Gap-Up: The market opens higher the next session, signaling confidence and aggressive bullish expectations.
Phase 3: Bearish Reversal: Instead of rising further, sellers push the price down aggressively, taking control from buyers.
Phase 4: Shift in Sentiment: Closing below the midpoint demonstrates that sellers have reversed much of the previous bullish progress, indicating weakening momentum and potential for a trend reversal.
This psychological shift is why the pattern is considered a valuable bearish signal.
How to Identify a Valid Dark Cloud Cover
To filter out weak or false patterns, use the following identification rules:
- Uptrend Requirement: The pattern must appear in an uptrend or at least after several rising candles.
- Strong Bullish First Candle: A small bullish candle weakens the signal.
- Gap-Up Opening: The second candle must open above the previous high. Without a gap-up, the pattern is not valid.
- Close Below Midpoint: The second candle must close below the midpoint of the prior bullish candle’s range.
- Avoid Small-Body Candles: A doji or small-bodied second candle signals indecision rather than reversal.
- Higher Timeframes Are More Reliable: Daily and weekly charts filter out noise better than intraday timeframes.
Interpretation of the Dark Cloud Cover Pattern
Interpretation depends heavily on price context, volume, trend structure, and nearby levels.
- Early Warning, Not a Standalone Signal: The Dark Cloud Cover signals weakening momentum but requires follow-through to confirm a reversal.
- Strong Rejection Pattern: The gap-up and subsequent bearish close reflect strong selling interest at higher prices.
- Context Matters: The pattern is far more meaningful near resistance zones or after overextended rallies.
- Reliability Improves With Confirmation: Confirmation can include lower highs, bearish candle follow-through, breakdowns, or volume increases.
- Weak Pattern Conditions: Avoid patterns with small bodies, insufficient gaps, or patterns formed in sideways markets.
How to Trade the Dark Cloud Cover
A structured approach helps traders use this pattern more effectively.
1. Spot the Pattern
Look for the two-candle structure during an uptrend.
2. Wait for Confirmation
Examples of acceptable confirmation:
- A third bearish candle
- Break below a support level
- A breakdown under a short-term moving average (10-EMA, 20-EMA)
- Bearish divergence on indicators such as RSI or MACD
Confirmation helps filter out noise and false reversals.
3. Determine Trade Direction
If confirmed:
- Exit long positions
- Consider entering short positions
- Adjust exposure if the market conditions appear unstable
4. Entry Options
- Enter after the confirmation candle closes
- Enter on a retest of the breakdown level
- Enter below the low of the Dark Cloud Cover candle
5. Stop Loss Placement
Set the stop-loss above the high of the second candle (or above the pattern’s high).
6. Profit Targets
Possible targets:
- Nearest support
- Previous swing low
- Fibonacci retracement level
- Risk-reward ratio such as 1:2 or 1:3
Example scanner based on Dark Cloud Cover
Traders often use scanners to automatically detect the Dark Cloud Cover in real time.
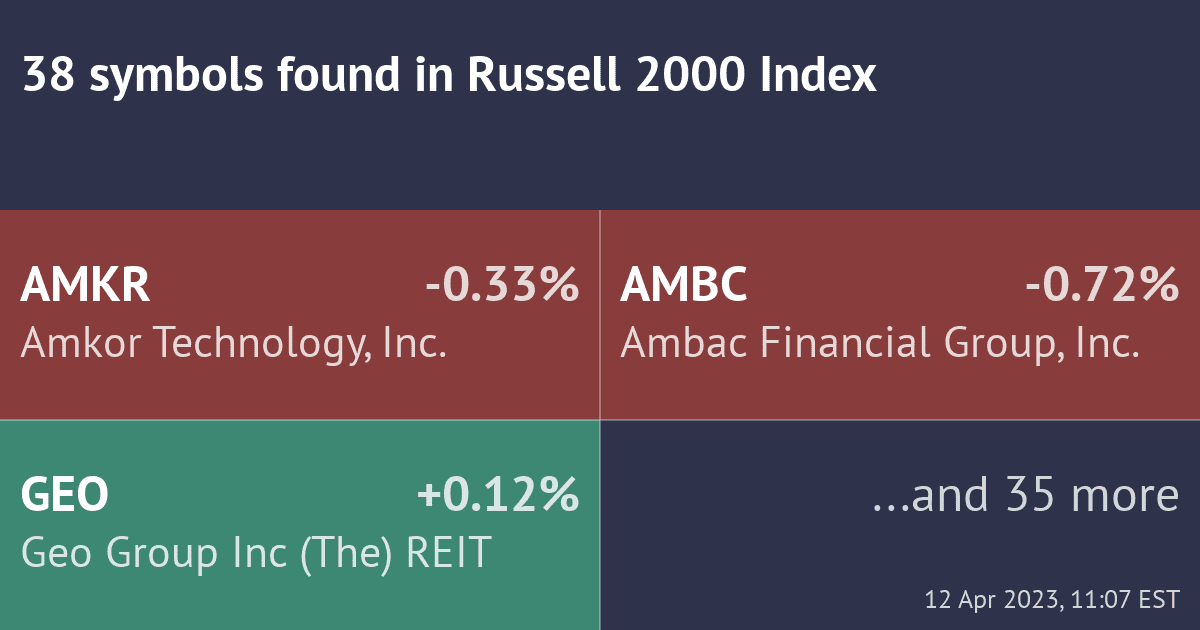
One example is the “Electrified Opportunity Detector” on TrendSpider, created by Dan Ushman. This scanner identifies:
- Uptrending stocks
- Large bullish candle
- Bearish candle closing below the midpoint
- Optional filters such as volume spikes, EMA rejection, and RSI divergence
Such scanners help traders quickly locate potential reversal candidates.
Real Example of the Dark Cloud Cover Pattern
Consider a stock that has risen steadily for several sessions:
- A strong bullish candle forms, showing continued buying pressure.
- The next session opens above the previous high, indicating optimism.
- Sellers take control and push the candle to close well below the midpoint of the previous candle.
- A subsequent bearish candle confirms the reversal.
- The trader exits long positions and sets a stop-loss above the pattern’s high.
- Price starts declining toward support zones.
This illustrates how the pattern serves as a clear early warning.

Advantages of the Dark Cloud Cover Pattern
- Straightforward and easy to identify
- Useful early signal of weakening bullish momentum
- Works well in combination with support/resistance
- Provides clear stop-loss placement
- Reliable across many markets and timeframes
- Effective in identifying distribution phases
Limitations of the Dark Cloud Cover Pattern
- Requires confirmation to avoid false signals
- Less effective in sideways or choppy markets
- Can fail during strong bullish trends
- Gap-up requirement may be rare in some markets
- Sensitive to news-driven volatility
- Should not be used as a standalone indicator
The Bottom Line
The Dark Cloud Cover is a valuable bearish reversal pattern that highlights a significant shift in market sentiment from bullish enthusiasm to increasing selling pressure. It helps traders identify early reversal opportunities, exit long trades before momentum fades, and enter strategic short positions.
However, the pattern must be used alongside confirmation tools, price structure, support/resistance analysis, and indicators such as RSI or MACD. When used correctly, the Dark Cloud Cover enhances decision-making, improves timing, and contributes to more effective risk management.
FAQs
Is the Dark Cloud Cover pattern bullish or bearish?
Bearish. It appears at the end of an uptrend and signals that sellers are overpowering buyers after a strong gap-up open fails.
Does the second candle always need to gap above the previous high?
Yes. The gap-up is a defining feature. Without it, the pattern loses its meaning and becomes a generic bearish candle, not a Dark Cloud Cover.
Can a shallow close still form a Dark Cloud Cover?
It can, but it’s weaker. The deeper the second candle closes into the first candle’s body — especially well below the midpoint — the stronger the bearish signal.
How reliable is the Dark Cloud Cover pattern?
Moderately reliable. Research and trader testing show best results when combined with confirmation such as a follow-through bearish candle, volume increase, or a support breakdown.
Which timeframe is best for Dark Cloud Cover?
Daily and weekly charts provide the highest reliability. It can appear on intraday charts, but smaller timeframes tend to produce more noise and false reversals.
What’s the difference between Dark Cloud Cover and a Bearish Engulfing pattern?
A Bearish Engulfing candle completely covers the previous candle’s body. Dark Cloud Cover only needs to close below the midpoint of the prior candle. Engulfing is stronger, but Dark Cloud Cover is more common.
Can Dark Cloud Cover be used in forex or crypto?
Yes. These markets may not always produce textbook gaps, but strong opens and deep bearish rejections still form functional equivalents that traders use in the same way.
Does Dark Cloud Cover guarantee a reversal?
No. It’s a warning sign, not a guarantee. Price may still continue upward if bulls regain control. Confirmation is essential before acting on the pattern.
Can the Dark Cloud Cover fail?
Yes. It often fails during strong bullish trends, news-driven gaps, or when the close is barely below the midpoint. Lack of volume or a weak bearish follow-up increases failure risk.
Is Dark Cloud Cover the same as Evening Star?
No. Evening Star is a three-candle reversal pattern. Dark Cloud Cover is a two-candle formation. Both are bearish, but they form differently and carry different strengths.


