Explore TrendSpider Custom Indicators
Custom Indicators are visualizations and scripts created on TrendSpider’s JavaScript Scripting System. They can utilize any of the real-time market and alternative data in TrendSpider to provide market context and signals to the user.
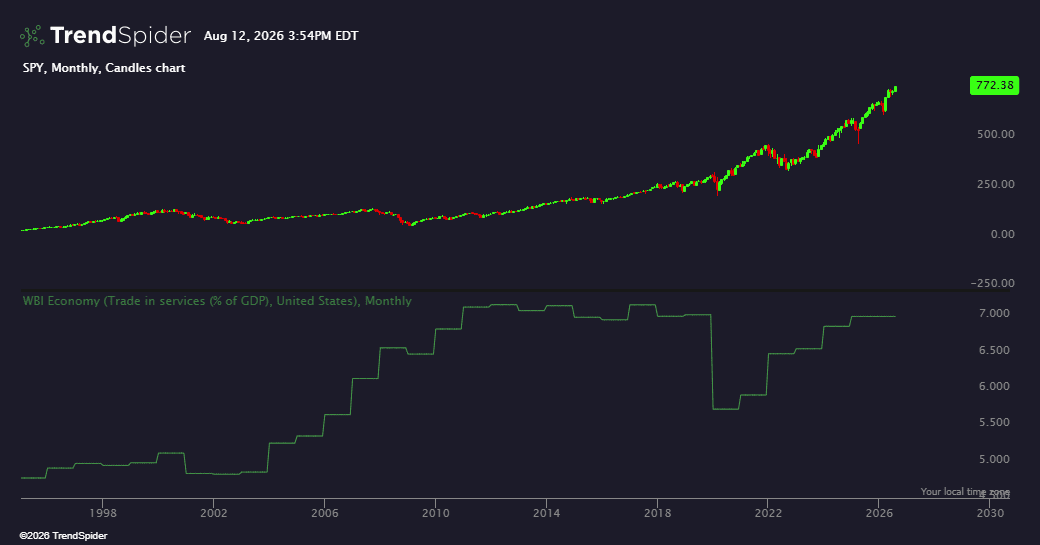
World Bank Indicators – Economy & Growth
General Idea This indicator fetches and displays economic data from the World Bank's public API. It allows you to visualize various macroeconomic indicators (like GDP, inflation, trade balance, government spending,...
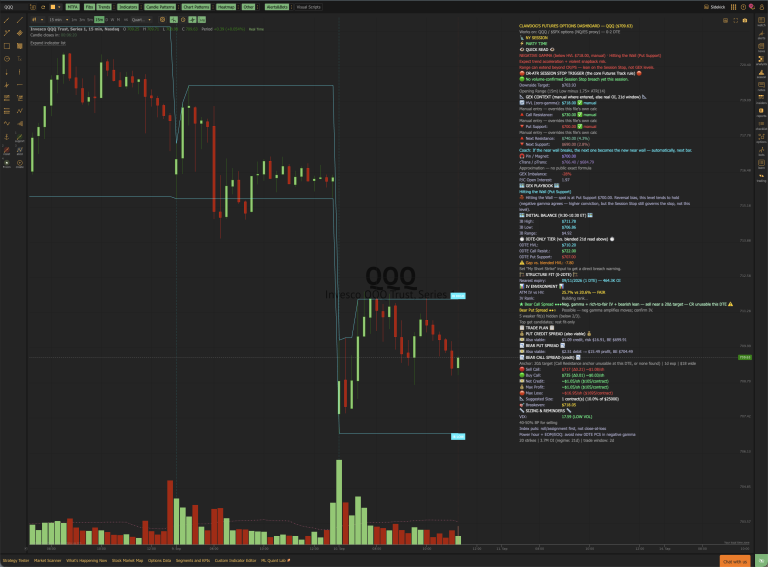
Clawdog's Futures Options Dashboard
Description Clawdog's Futures Options Dashboard is built for NQ and ES traders who want an options based read without an options chain of their own to work from. Since futures...
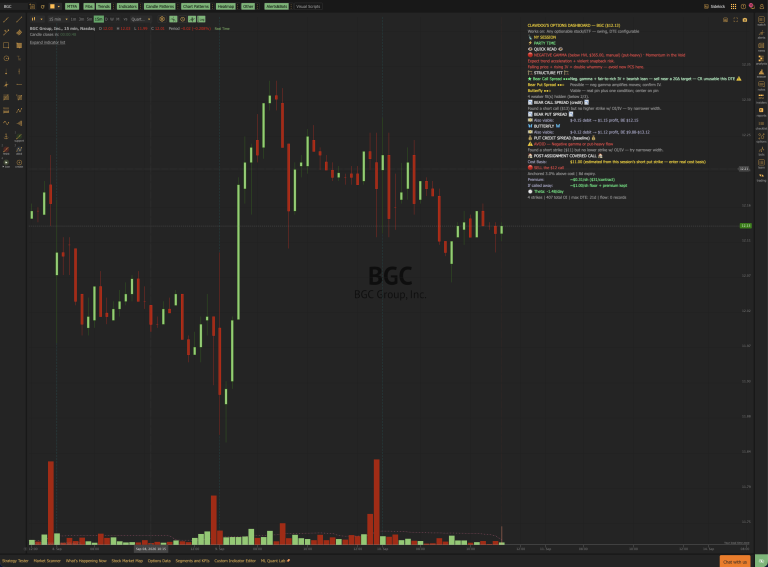
Clawdog's Options Dashboard
Description Clawdog's Options Dashboard scores seven option spread strategies against current conditions on every single bar, prices real strikes off the live options chain, and tells you whether today is...
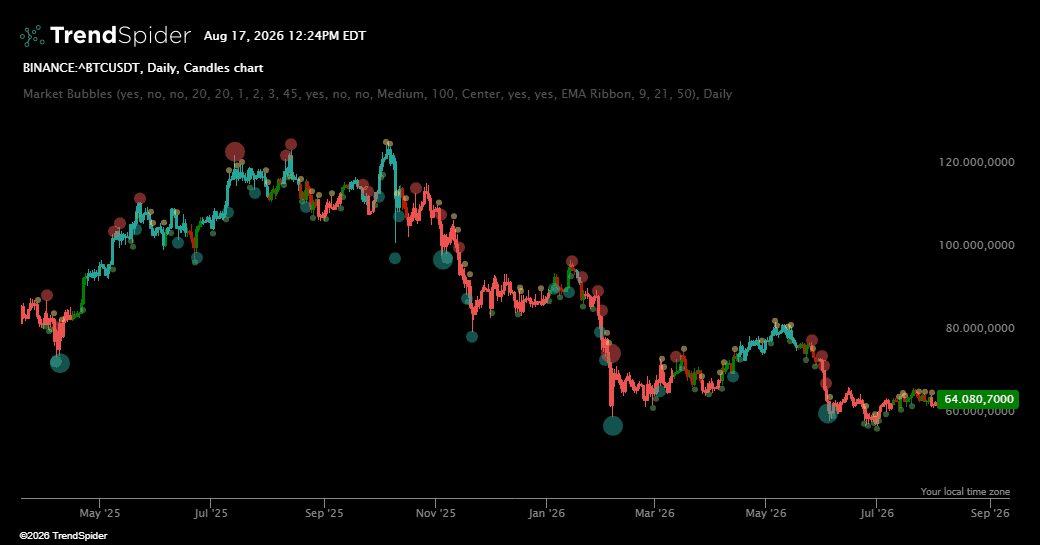
Market Bubbles
Market Bubbles is a professional chart visualization indicator designed to make exceptional market activity easier to recognize at a glance. It transforms notable buying and selling pressure into clear visual...
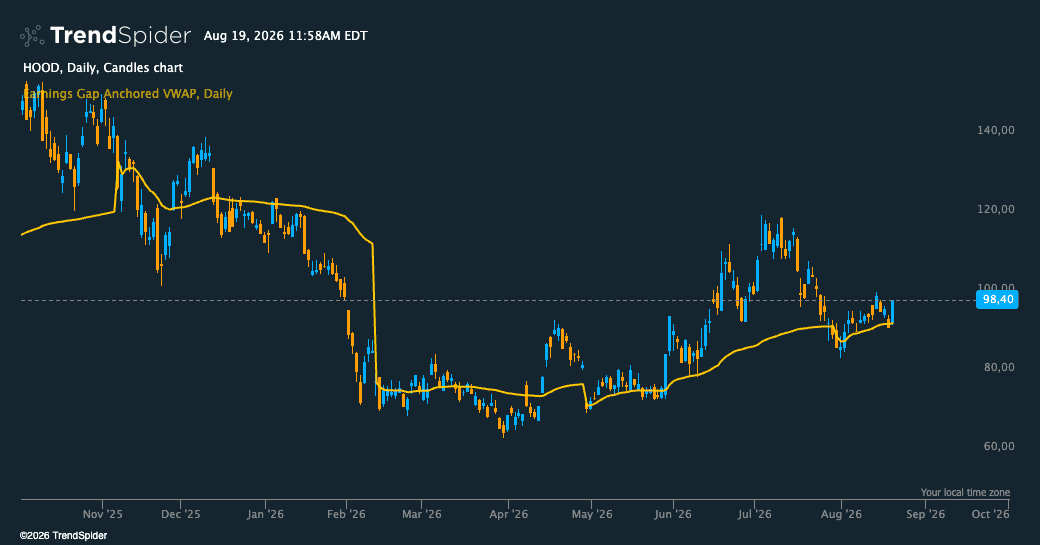
Earnings Gap Anchored VWAP
Earnings Gap Anchored VWAP automatically anchors a new VWAP to the first trading bar following each earnings report. The indicator is designed to help traders evaluate how price behaves relative...
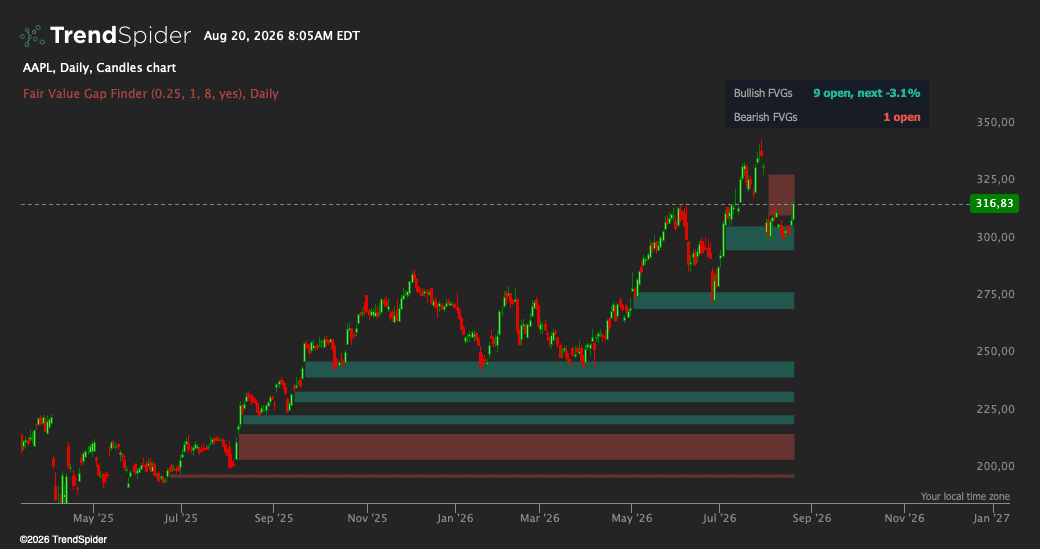
Fair Value Gap Finder
This indicator detects fair value gaps the moment they complete and manages their entire life on the chart for you. A fair value gap is a three candle imbalance: a...
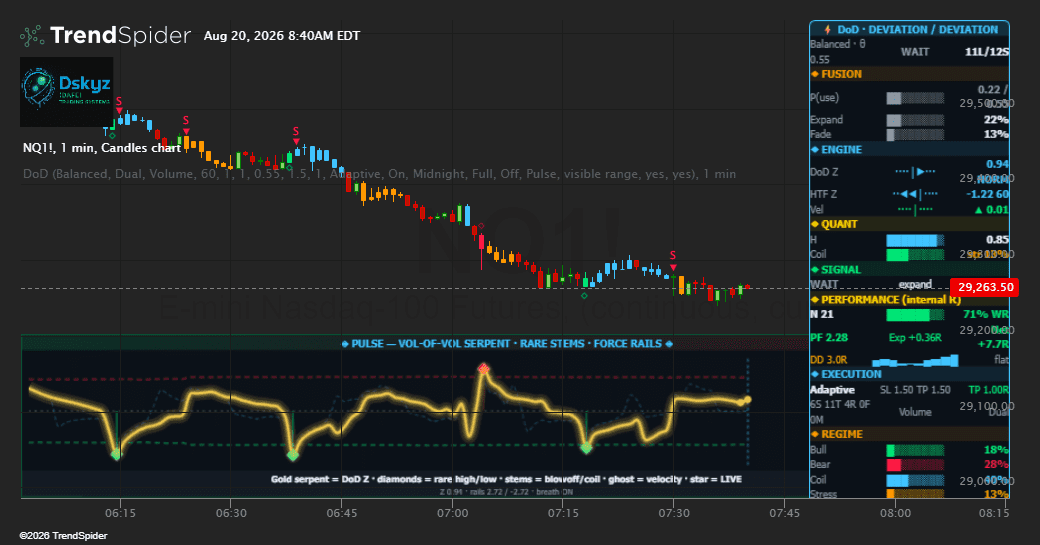
Deviation over Deviation (DoD)
Deviation over Deviation (DoD) · Dskyz | DAFE Trading Systems Most indicators ask: “Is price up or down?” DoD asks: “Is the chaos itself unusual?” It measures the volatility of...
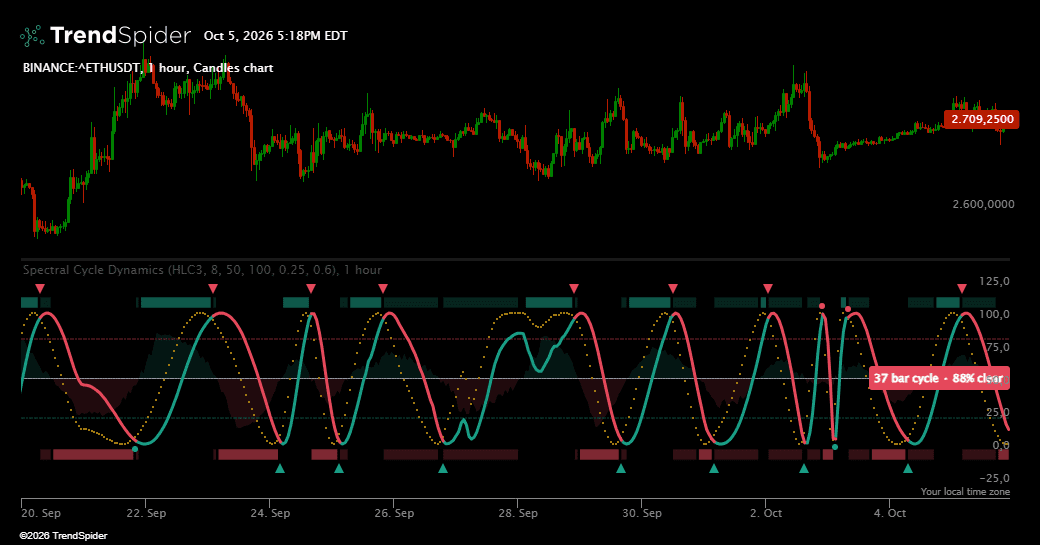
Spectral Cycle Dynamics
Spectral Cycle Dynamics finds the dominant market cycle with a spectral analysis of price and shows where price currently sits inside that cycle. The pane runs from 0 at a...
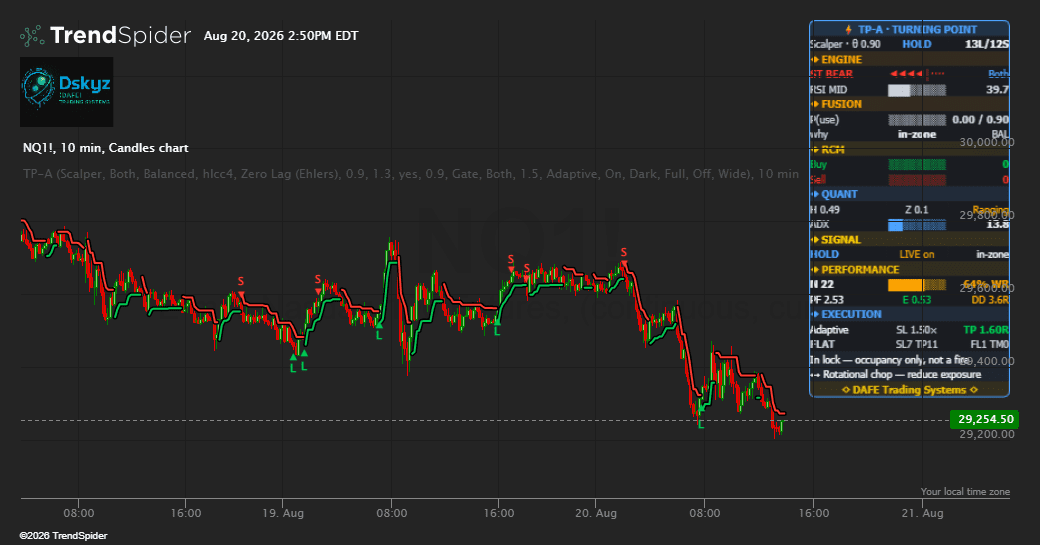
Turning Point – Advanced
Turning Point Advanced (TP-A) By: Dskyz | DAFE Trading Systems SuperTrend turning points with a small menu. Fusion grades the native cross; it does not invent a second one. Scalper...
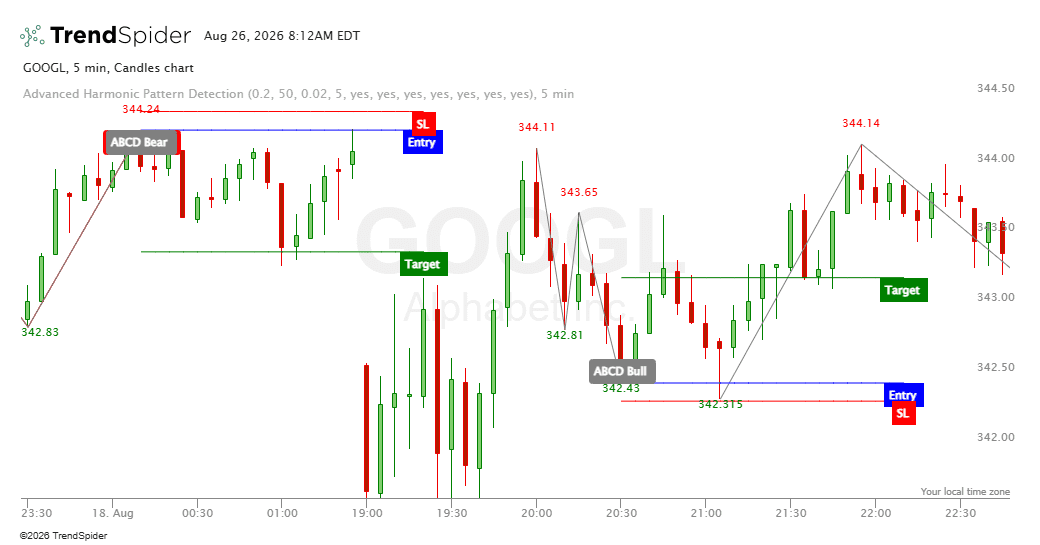
Advanced Harmonic Pattern Detection
Patterns Detected Gartley, Bat, Butterfly, Crab, Cypher, Shark, ABCD — bullish and bearish, plotted with automatic Entry, Target, and Stop-Loss lines. Settings ZigZag Min % controls pattern size. Lower value...
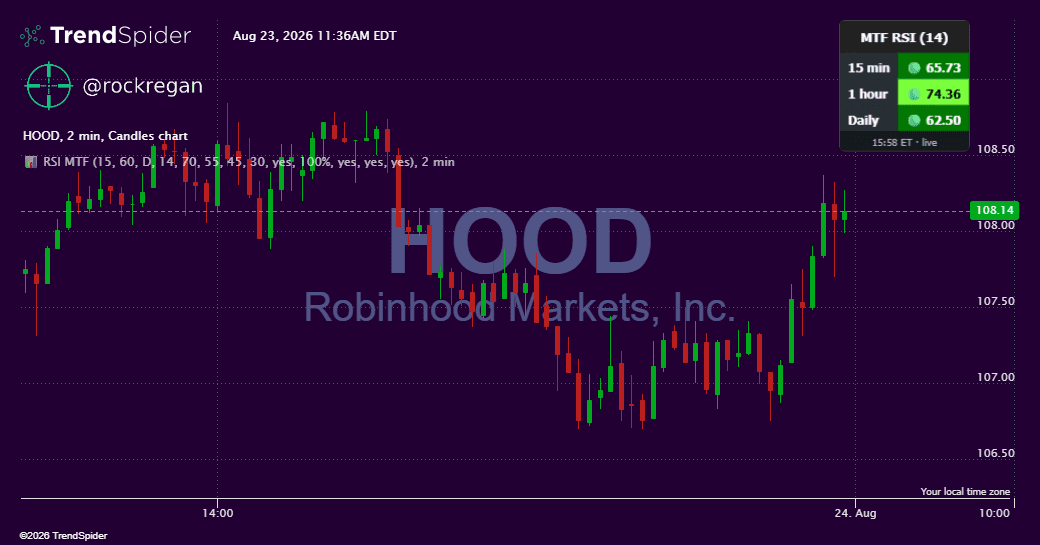
RSI MTF Stack
A clean multi-timeframe RSI dashboard designed to keep momentum context directly on your chart. RSI MTF Stack displays RSI readings from three user-selectable timeframes in a compact on-chart table, making...
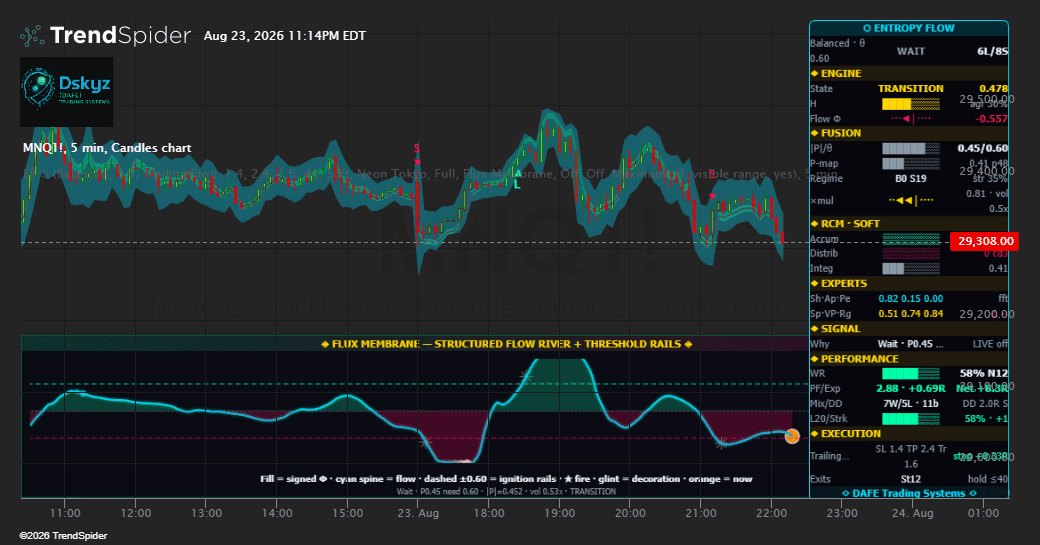
Entropy Flow [Dskyz]
Entropy Flow (EF ⬡) By: Dskyz | DAFE Trading Systems Markets swing between order and noise. Entropy Flow measures that directly — six entropy sensors (entropy = how disordered price...