Explore TrendSpider Custom Indicators
Custom Indicators are visualizations and scripts created on TrendSpider’s JavaScript Scripting System. They can utilize any of the real-time market and alternative data in TrendSpider to provide market context and signals to the user.
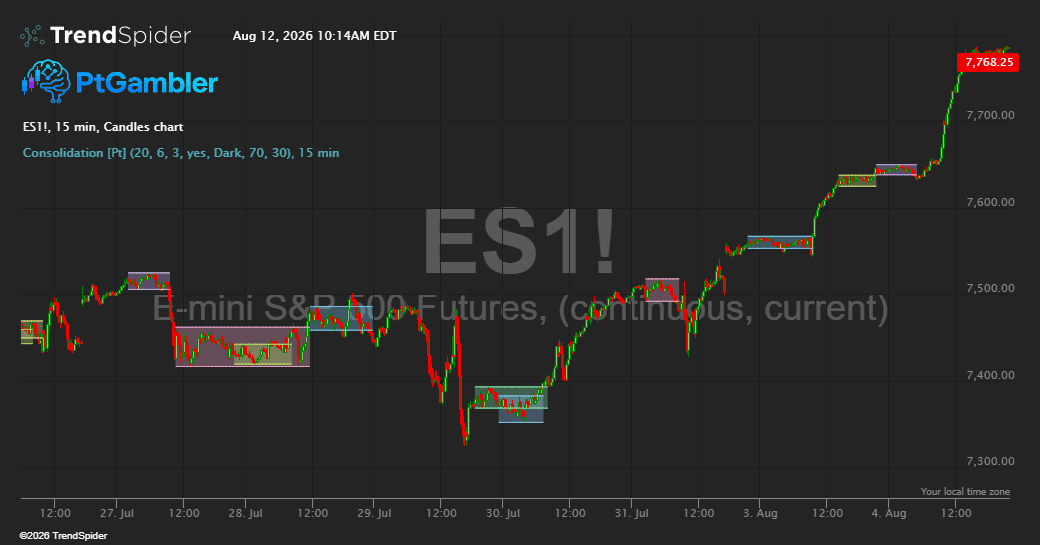
Consolidation Range Detector [Pt]
Consolidation Range Detector [Pt] Markets do not always move in a clear direction. Price often pauses and moves sideways within a limited area before continuing, reversing, or breaking into a...
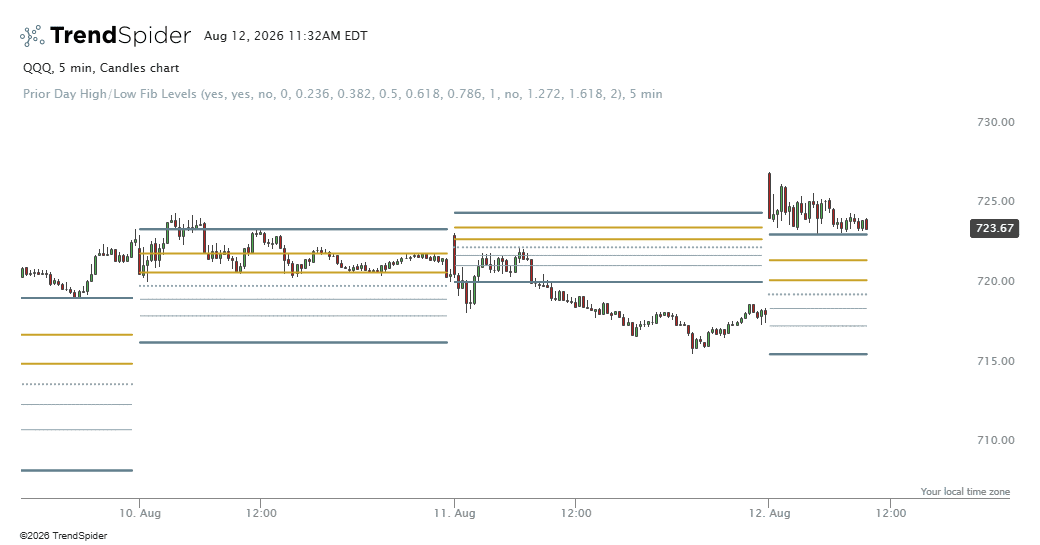
Prior Day High/Low Fib Levels v2.6
General Idea This indicator plots Fibonacci retracement levels based on the previous day's high and low prices on intraday charts. It shows you where price might find support or resistance...
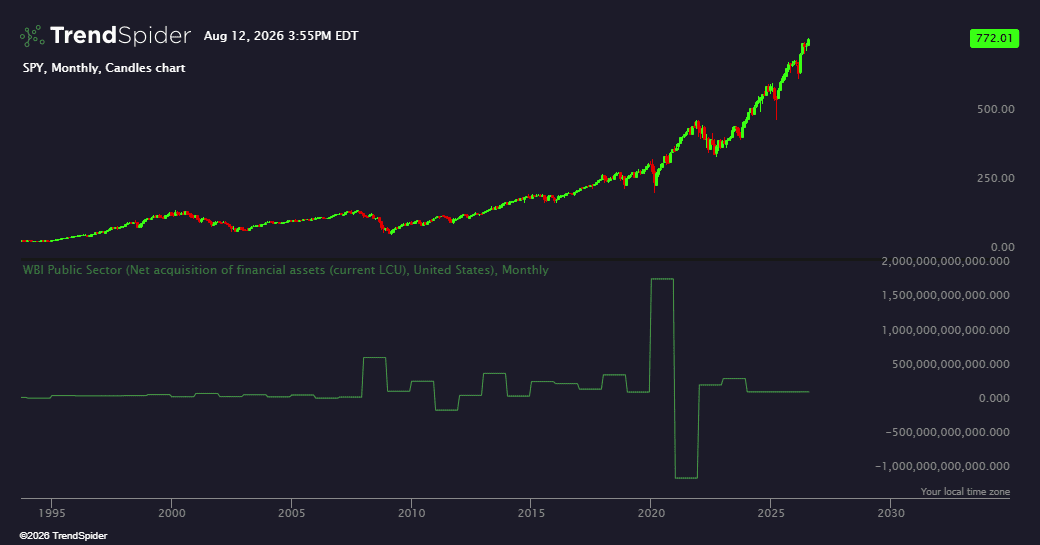
World Bank Indicators – Public Sector
General Idea This indicator fetches and displays public sector data from the World Bank API. It allows you to visualize various government financial metrics (like tax revenue, debt, or military...
World Bank Indicators – Social Development
General Idea This indicator fetches and displays World Bank social development statistics (like education enrollment rates, unemployment rates, life expectancy, etc.) for various countries. It overlays this fundamental economic data...
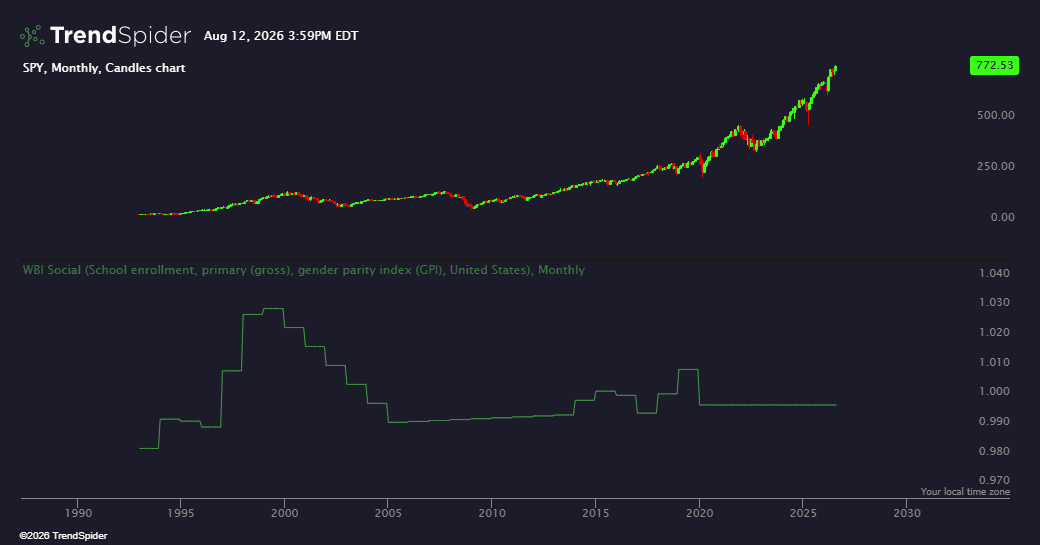
Auction Convexity Pressure Map
Auction Convexity Pressure Map is a professional market context and trade location indicator that organizes complex price behavior into a clear visual framework. It brings structure, value, volatility, participation, and...
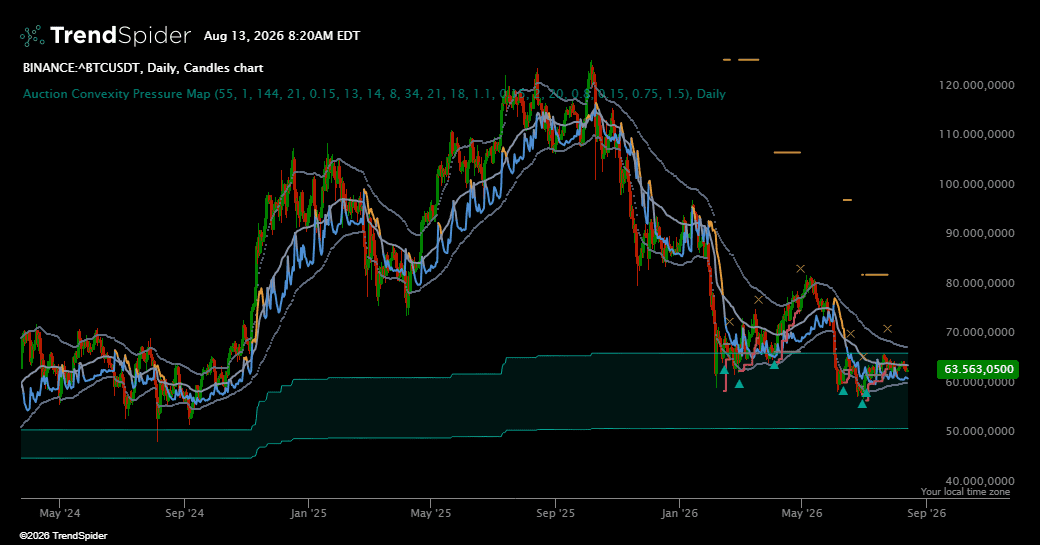
Volatility Reclaim Probability Bands
Volatility Reclaim Probability Bands frames price inside a volatility envelope that breathes with the market and highlights the moments when an overextended move fails. When price pushes beyond a band...
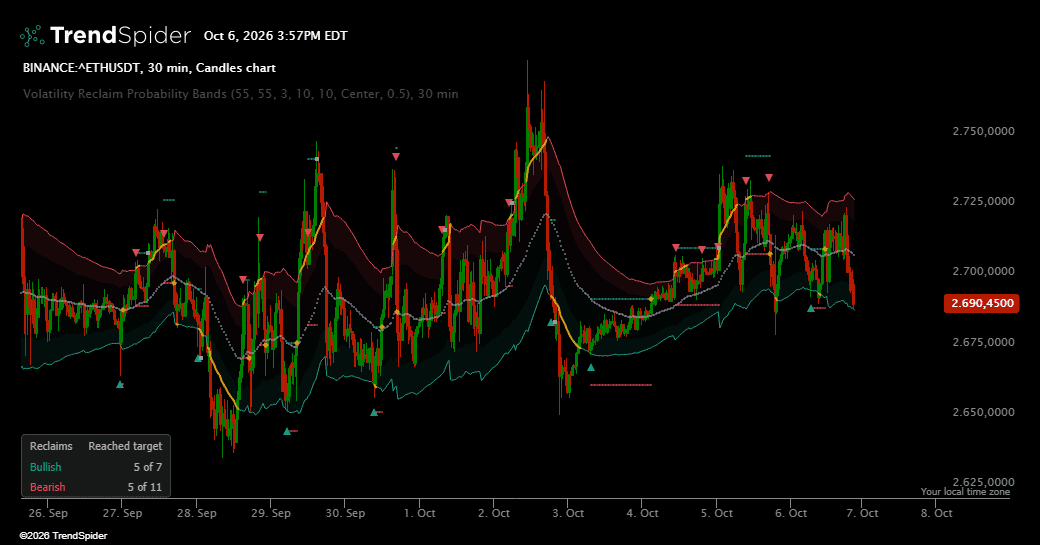
VWAP Reversion & Earnings Drift Signals
VWAP Reversion and Earnings Drift Signals is a professional market context indicator created for traders who want to study two widely observed sources of price behavior within one focused workspace....
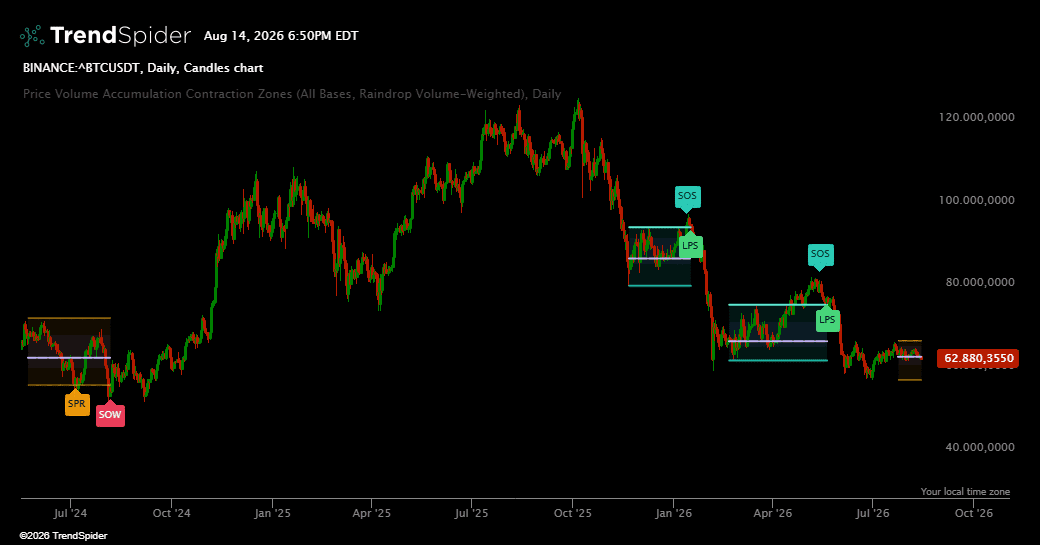
Price Volume Accumulation Contraction Zones
Price Volume Accumulation Contraction Zones is a professional market structure indicator designed to reveal areas where constructive accumulation and price contraction may be developing beneath the surface. Instead of treating...
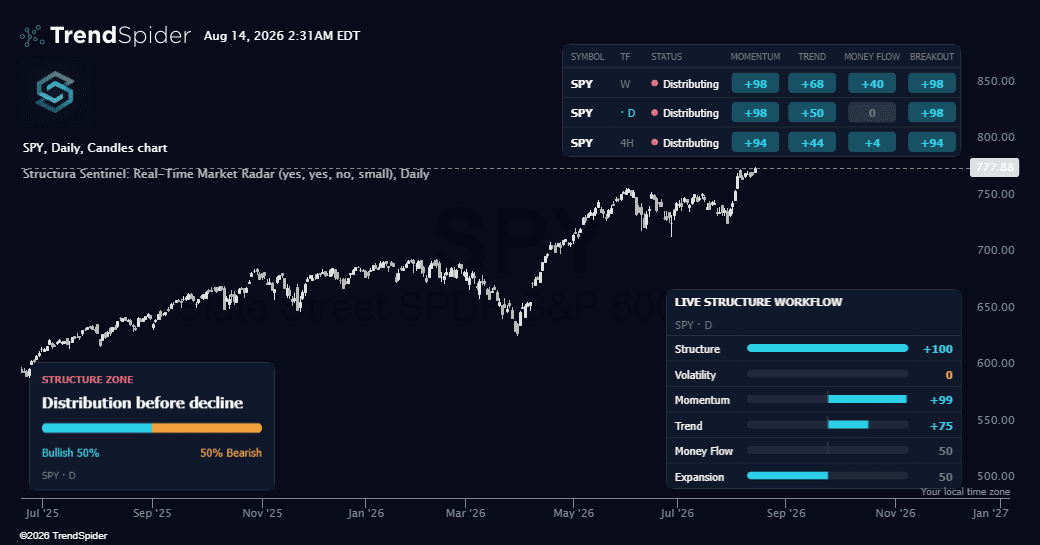
Structura Sentinel: Real-Time Market Radar
STRUCTURA SENTINEL Where is something starting to happen? Chart-hopping is the most expensive habit in trading - not in money, in attention. Sentinel puts the conditions from the Structura workflow...
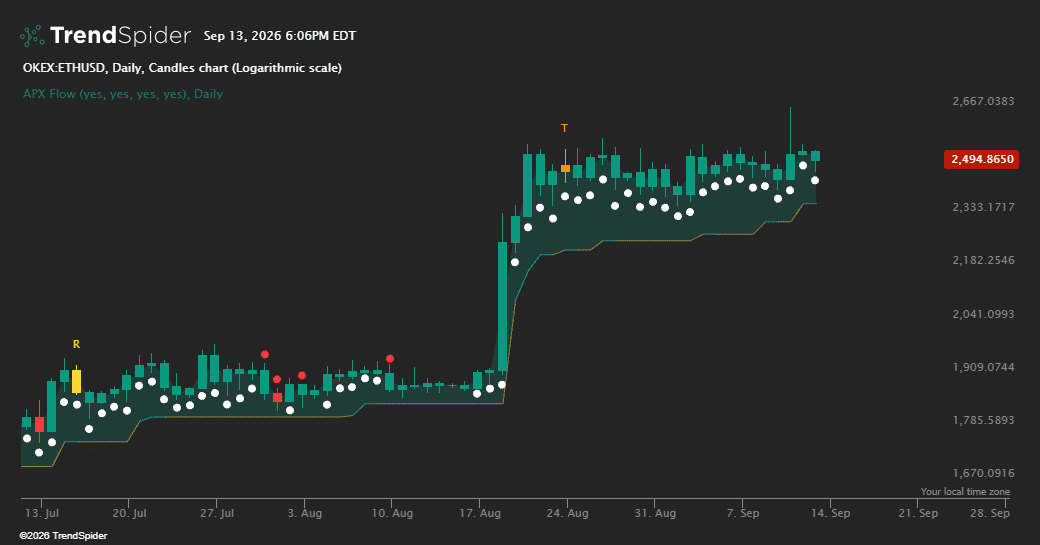
APX Flow
APX Flow APX Flow is a trend-and-reversal overlay. It combines a Supertrend-style flow line, macro/micro EMA bias, and MACD-histogram pivots so you can see direction, exhaustion, and turns on the...
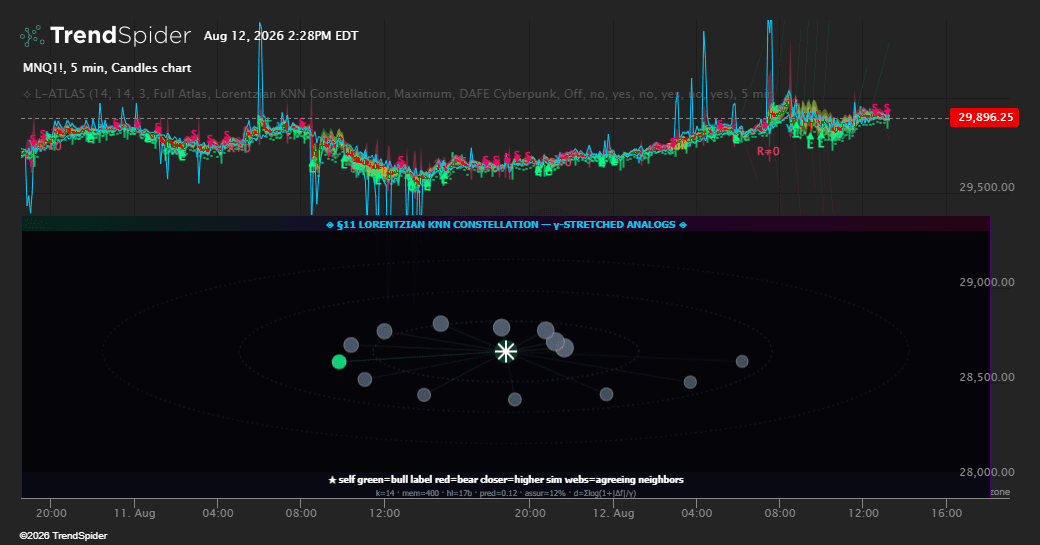
Lorentzian Mathematics: Complete Variation Atlas
Lorentzian Mathematics: Complete Variation Atlas [DAFE] By: Dskyz | DAFE Trading Systems Most “Lorentzian” tools borrow a γ label and stop there. L-ATLAS does the opposite: it treats the chart...
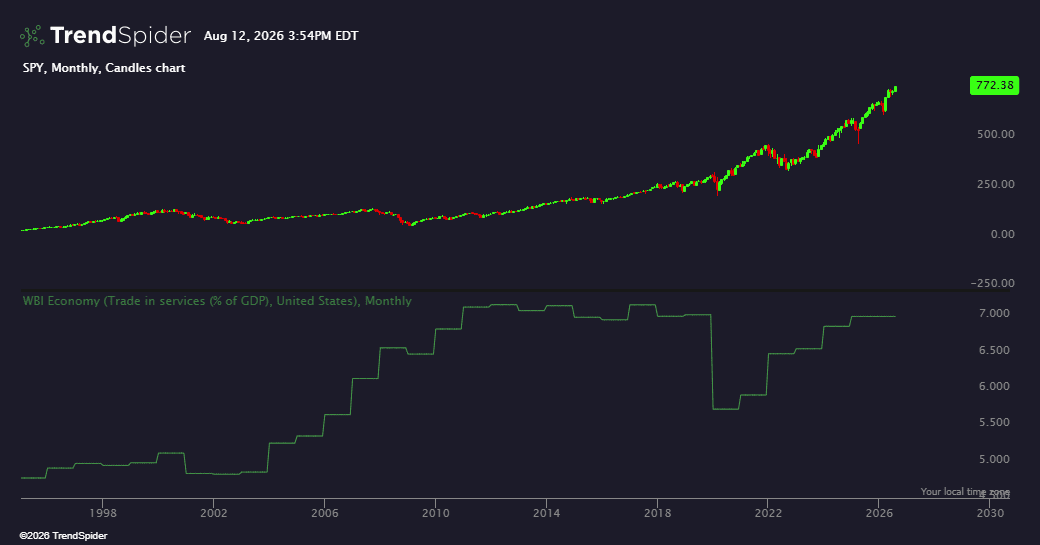
World Bank Indicators – Economy & Growth
General Idea This indicator fetches and displays economic data from the World Bank's public API. It allows you to visualize various macroeconomic indicators (like GDP, inflation, trade balance, government spending,...