Explore TrendSpider Custom Indicators
Custom Indicators are visualizations and scripts created on TrendSpider’s JavaScript Scripting System. They can utilize any of the real-time market and alternative data in TrendSpider to provide market context and signals to the user.
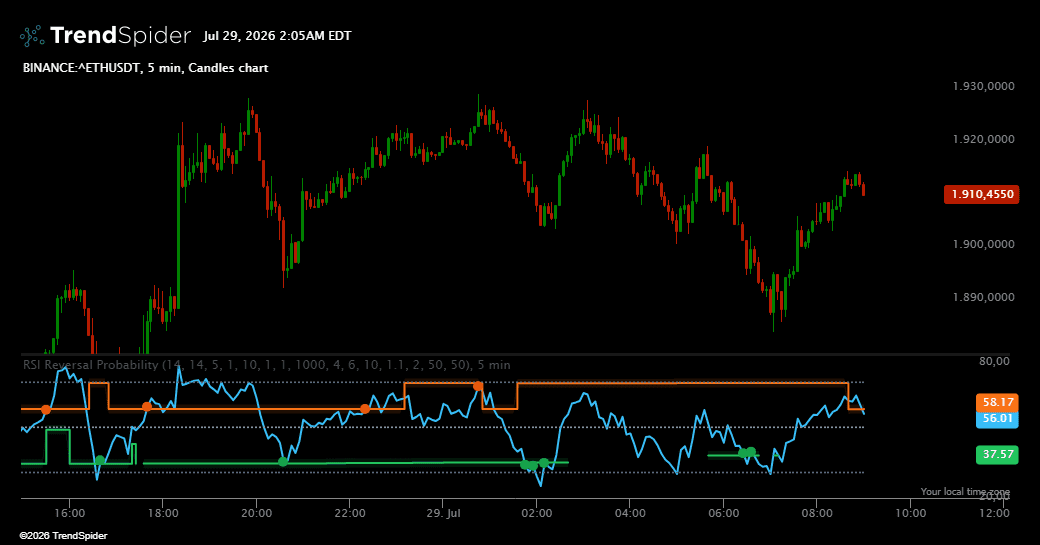
RSI Reversal Probability
RSI Reversal Probability is a professional momentum oscillator designed to help traders identify areas where price may be approaching a meaningful change in direction. Instead of treating traditional RSI levels...
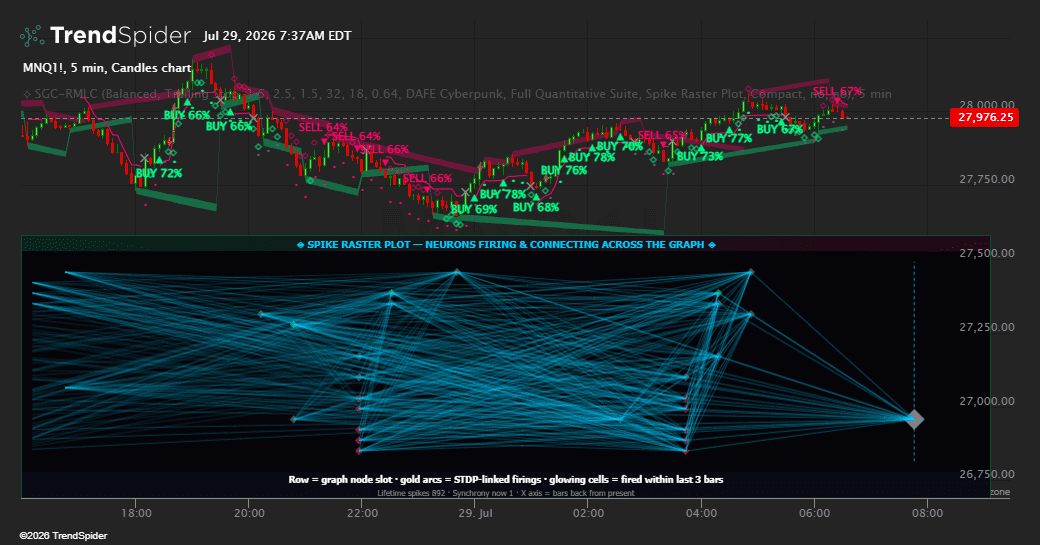
Spiking Graph: Real Machine Learning Concepts
Spiking Graph: Real Machine Learning Concepts (SGC-RMLC) By: Dskyz | DAFE Trading Systems Most “AI” indicators are costumes—moving averages with a sticker. SGC-RMLC is a live Spiking Neural Network running directly on...
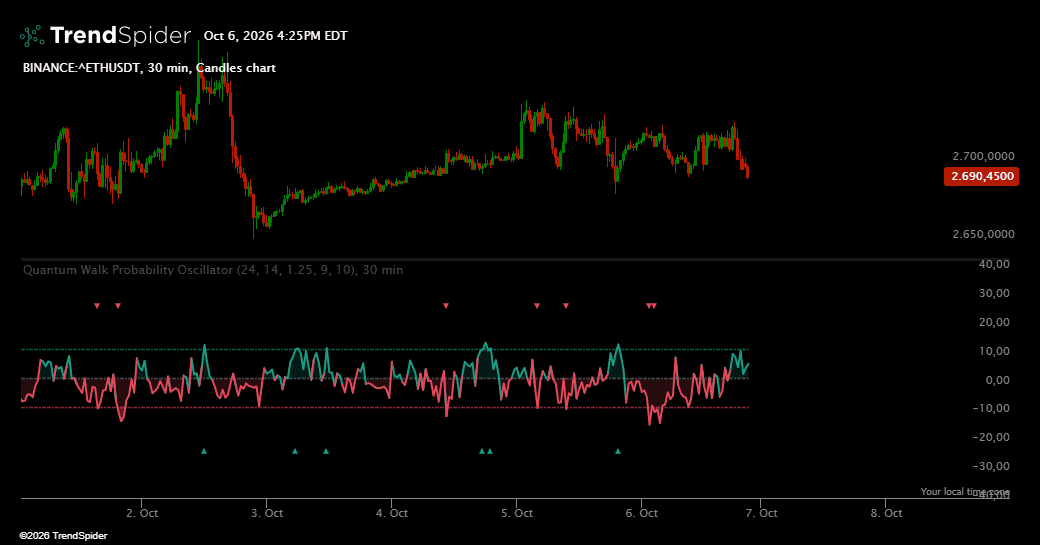
Quantum Walk Probability Oscillator
Quantum Walk Probability Oscillator looks at recent price action through the lens of a quantum random walk. Each bar's move, scaled by volatility, rotates the phase of a walker that...
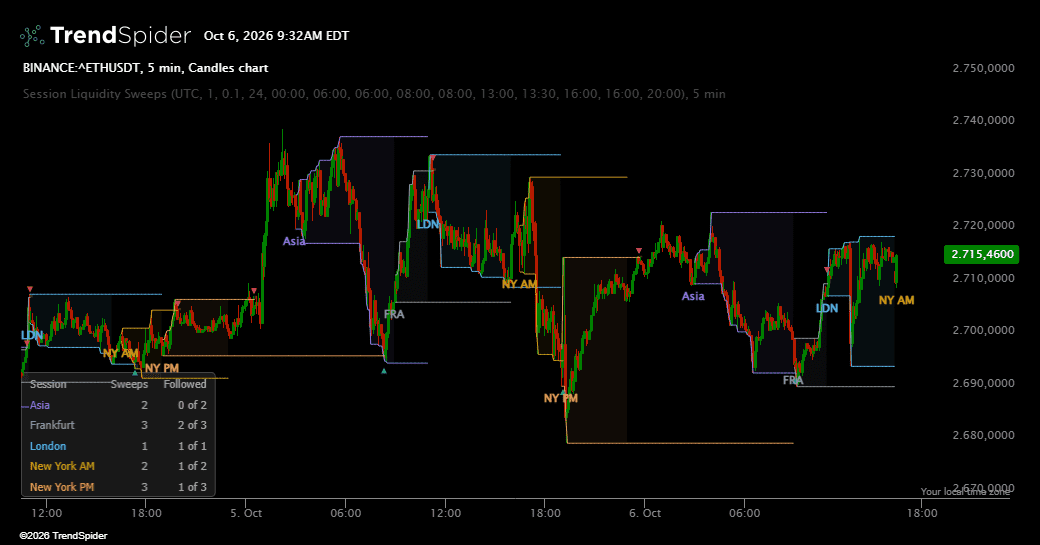
Session Liquidity Sweeps
Session Liquidity Sweeps maps the high and low of every major trading session and watches what happens when the next session reaches for them. Session extremes are where many stops...
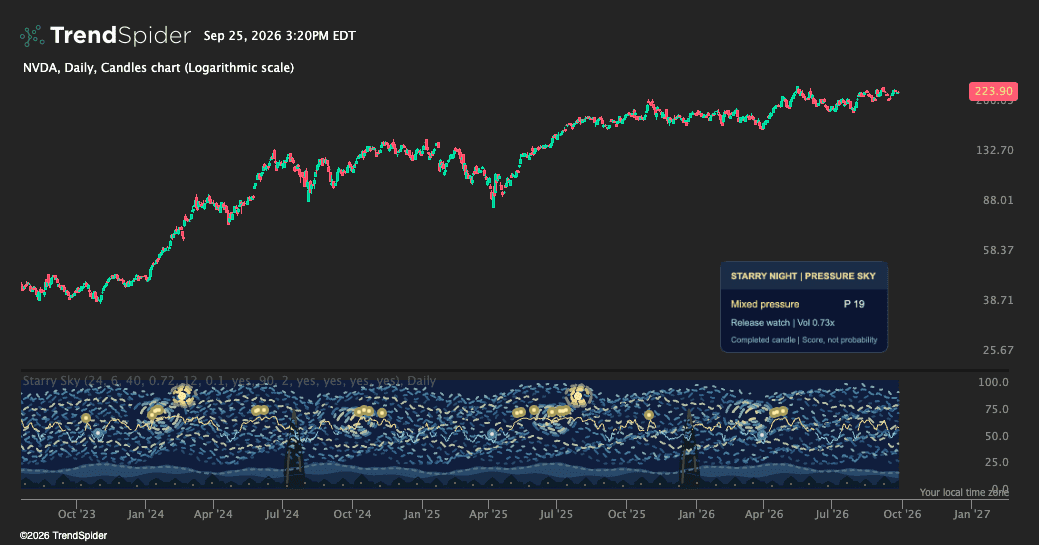
Starry Night – Pressure Sky
Starry Night — Pressure Sky transforms volatility, price pressure, and range breakouts into a painted night landscape inspired by Vincent van Gogh. Cobalt brushstrokes, curved skies, golden lights, and village...
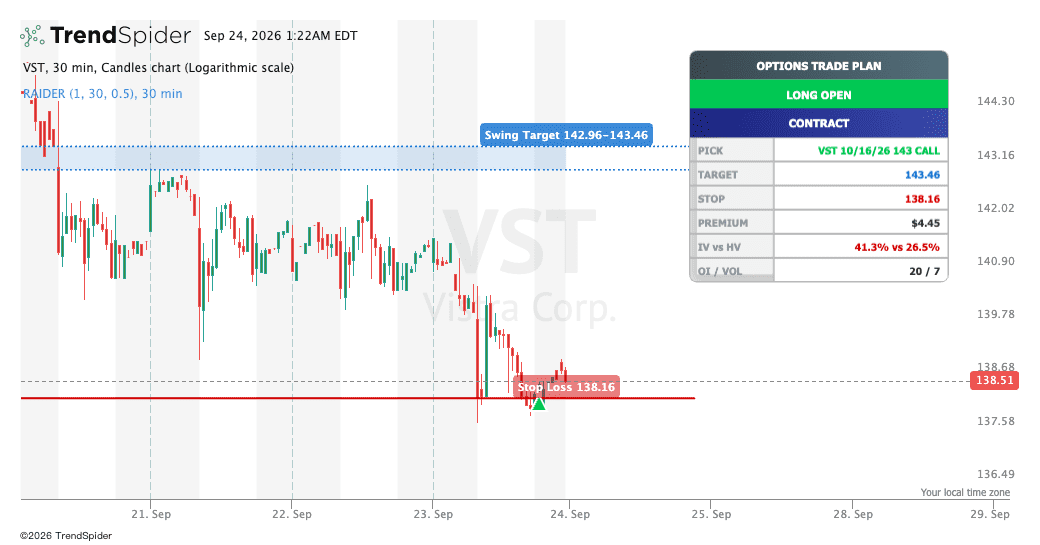
Options Trade Plan — Trigger, Target & Trailing Stop
Options Trade Plan — Trigger, Target & Trailing Stop A complete options trade plan on the 30-minute chart: the direction worth trading, the entry trigger, a target, a trailing stop,...
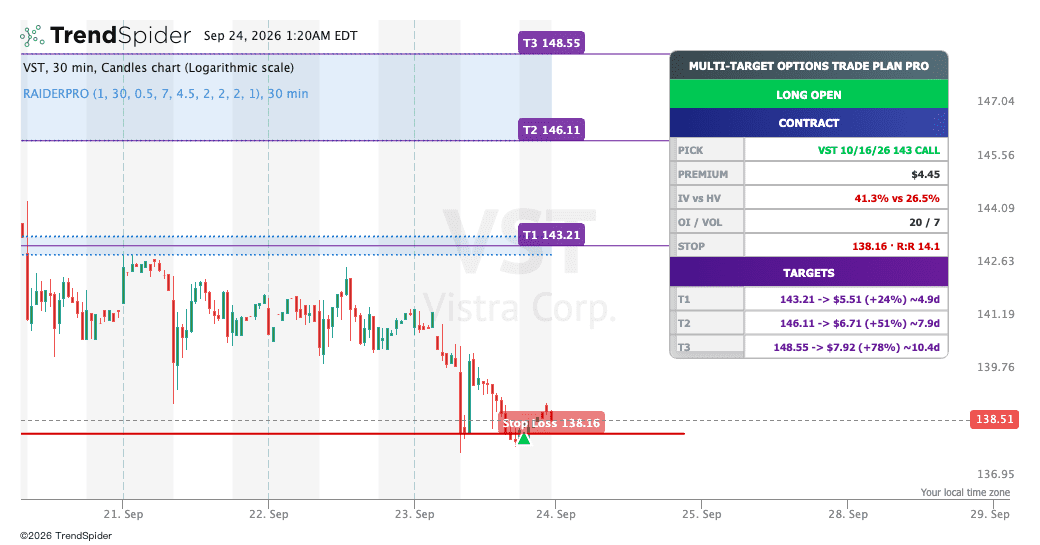
Multi-Target Options Trade Plan Pro — Trigger, Target & Trai
Multi-Target Options Trade Plan Pro — Trigger, Target & Trailing Stop A complete options trade plan on the 30-minute chart: direction, entry trigger, a ladder of price targets, the contract...
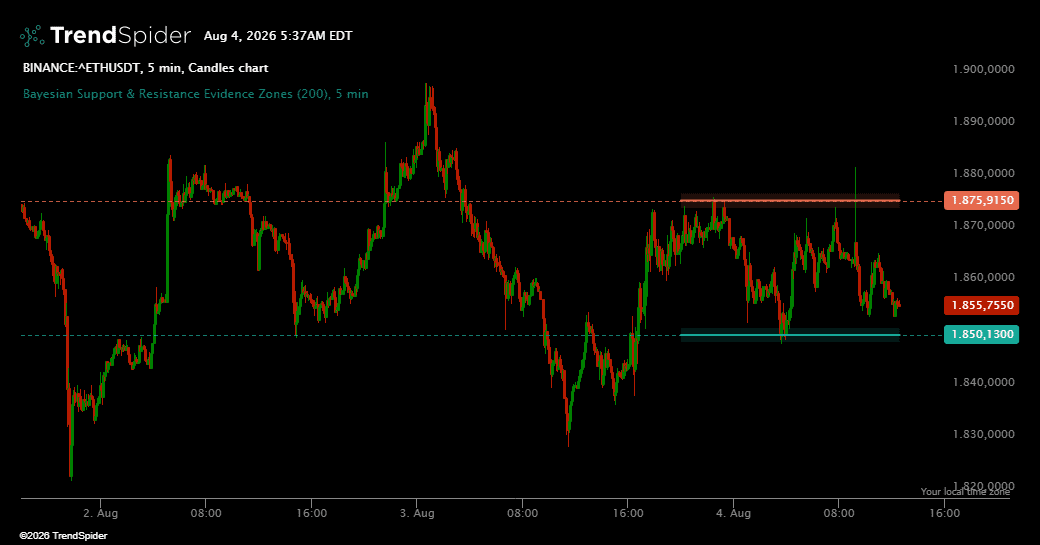
Bayesian Support & Resistance Evidence Zones
Bayesian Support & Resistance Evidence Zones is a quantitative market structure indicator that presents support and resistance as areas of statistical interest rather than perfectly precise price lines. It is...
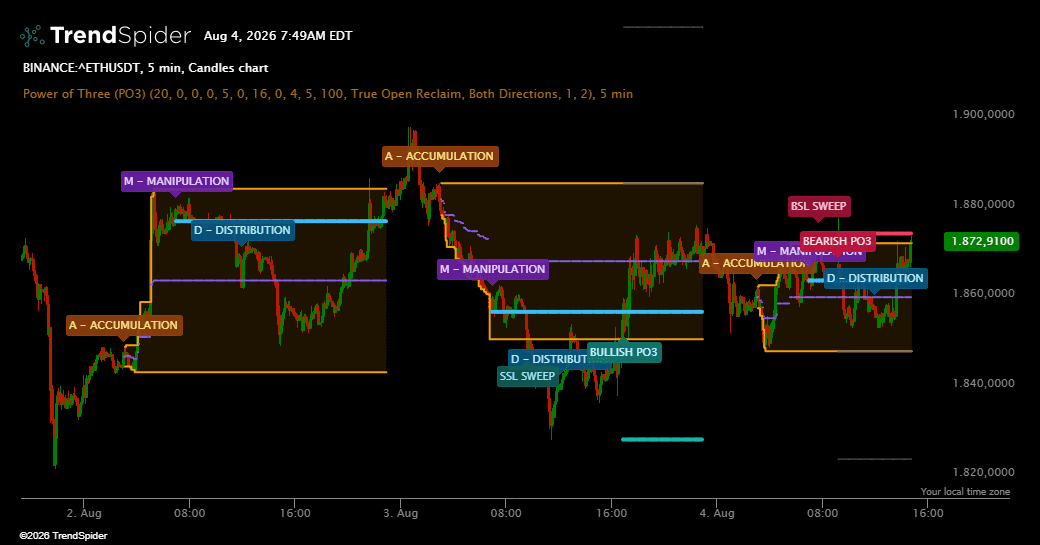
Power of Three (PO3)
ICT Power of Three Sessions presents the Power of Three market framework in a clear, structured, and practical visual format. It helps traders observe the relationship between accumulation, liquidity activity,...
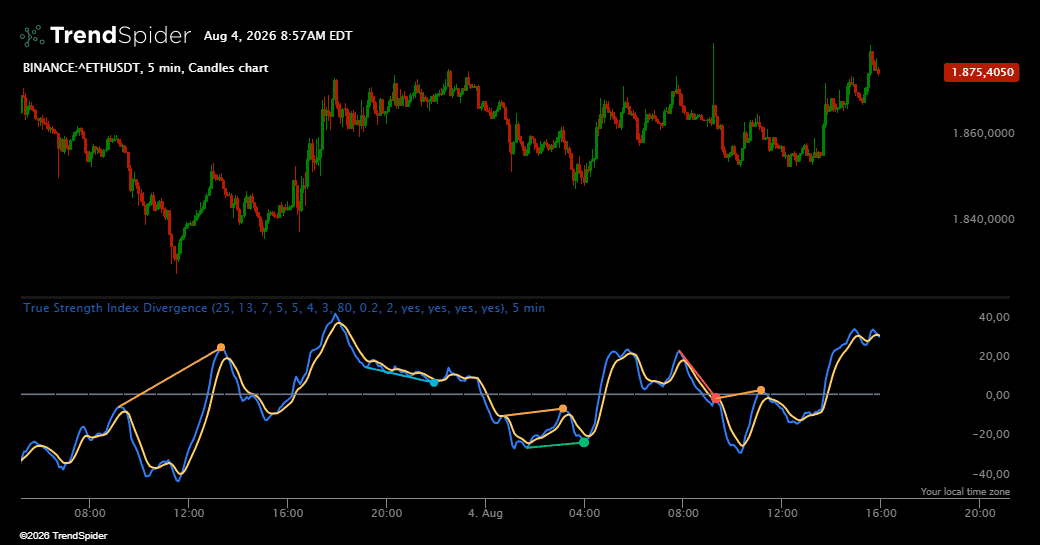
True Strength Index Divergence
This indicator is built for traders who want a cleaner way to read momentum behavior and reversal pressure without overloading the chart with unnecessary complexity. It combines a refined momentum...
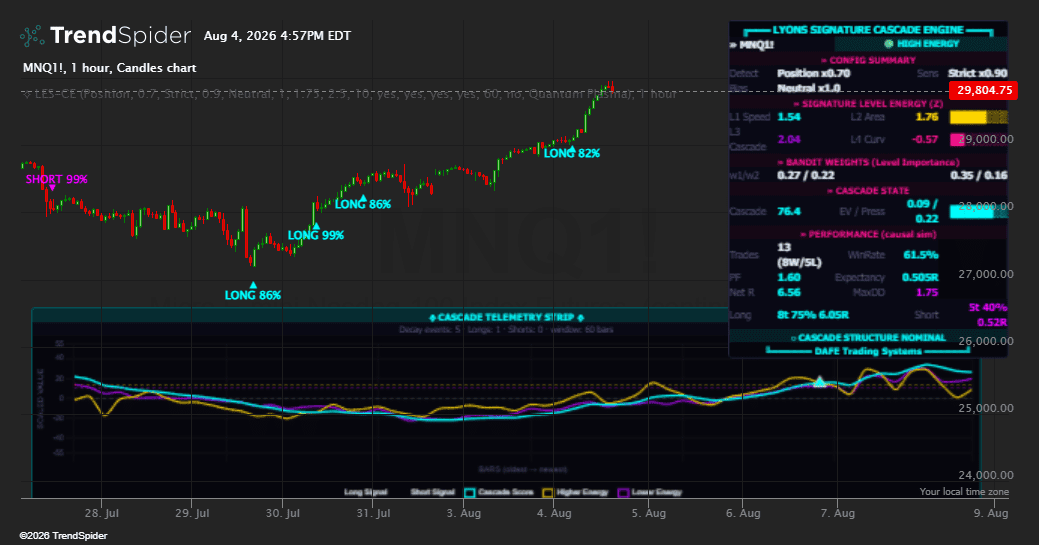
LES-CE · Lyons Signature Cascade
Lyons-Enhanced Signature Cascade Engine (LES-CE) By: Dskyz | DAFE Trading Systems Most “AI” indicators are cosplay. A couple of moving averages, a neural-net sticker, and a sales page. LES-CE is...
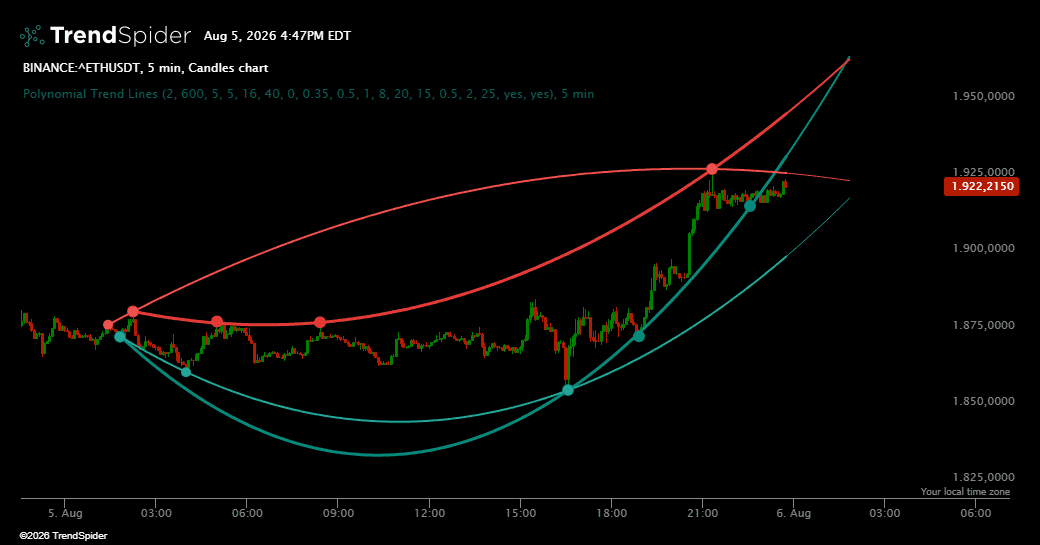
Polynomial Trend Lines
Polynomial Trend Lines is a professional market structure indicator designed to identify curved support and resistance relationships that traditional straight trend lines may overlook. Markets do not always develop at...