Disclaimer
All information shown on this page is for illustrative purposes only and should not be construed as investment, financial, market or other advice. Any information shown on this page that purports to be based upon past or current market conditions may not be complete, timely or accurate and, in any event, is not predictive of future outcomes.
Report This Indicator
(Market Structure Break (MSB) Indicator)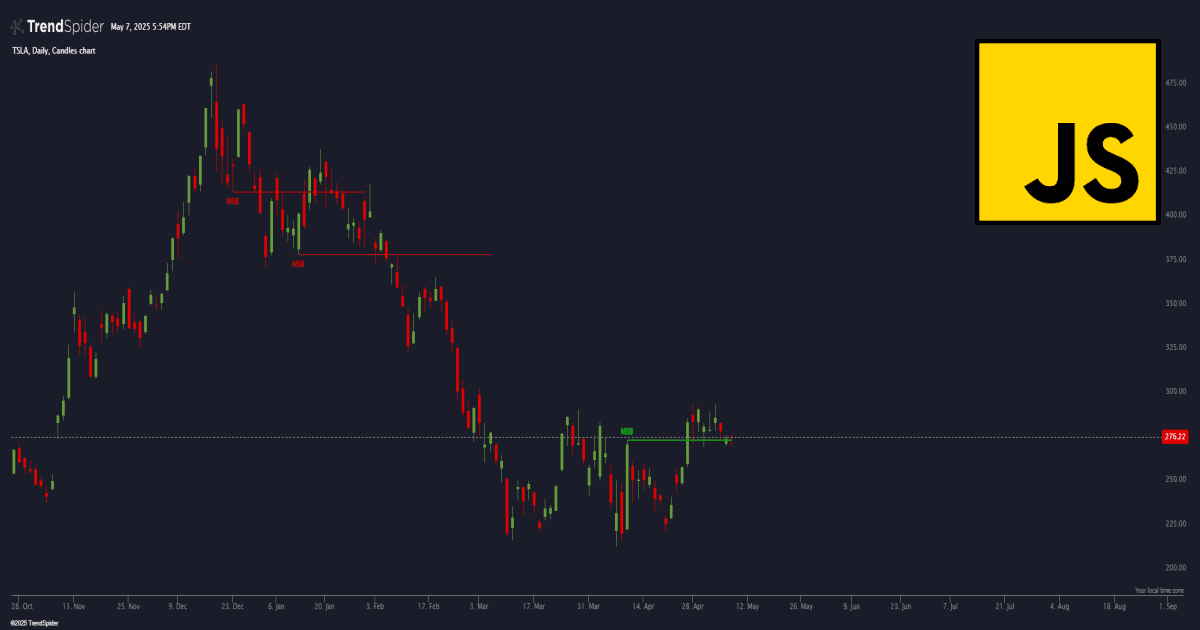
This indicator detects market structure breaks (MSBs) by identifying key swing highs and swing lows and marking when price closes above a swing high (bullish MSB) or below a swing low (bearish MSB).
Swing High: A high with two lower highs on either side.
Swing Low: A low with two higher lows on either side.
Features:
✅ MSB Labels & Lines – Marks MSBs with a label and a horizontal line extending from the broken swing level.
✅ Color Coding – Green for bullish MSBs, red for bearish MSBs.
✅ Customizable Line Style – Adjust line thickness, color, dash pattern, and length (default: 50 bars).
✅ Smart Line Expiration – Prevents old MSB lines from extending indefinitely to reduce clutter.
This indicator helps traders visualize shifts in market structure and identify key breakout levels with precision. 🚀
describe_indicator('Market Structure Break (MSB) Detector');

// Input parameters for customization
const swingLookback = input.number('Swing Lookback', 3, { min: 2 });
const bullishColor = input.color('Bullish MSB Color', '#00FF00');
const bearishColor = input.color('Bearish MSB Color', '#FF0000');
const lineLength = input.number('MSB Line Length (bars)', 20, { min: 10, max: 200 });
const msbLookback = input.number('MSB Lookback Period', 100, { min: 1, max: 1000 });

// Function to detect swing highs and lows
const detectSwings = (high, low, lookback) => {
    const swingHighs = series_of(null);
    const swingLows = series_of(null);
    for (let i = lookback; i < high.length - lookback; i++) {
        let isSwingHigh = true;
        let isSwingLow = true;
        for (let j = 1; j <= lookback; j++) {
            if (high[i - j] >= high[i] || high[i + j] >= high[i]) {
                isSwingHigh = false;
            }
            if (low[i - j] <= low[i] || low[i + j] <= low[i]) {
                isSwingLow = false;
            }
        }
        if (isSwingHigh) {
            swingHighs[i] = high[i];
        }
        if (isSwingLow) {
            swingLows[i] = low[i];
        }
    }
    return { swingHighs, swingLows };
};

// Detect swings
const { swingHighs, swingLows } = detectSwings(high, low, swingLookback);

// Detect Market Structure Breaks
const bullishMSB = series_of(null);
const bearishMSB = series_of(null);
const bullishMSBLines = [];
const bearishMSBLines = [];
let lastSwingHighIndex = null;
let lastSwingLowIndex = null;

for (let i = swingLookback; i < close.length; i++) {
    if (swingHighs[i] !== null) {
        lastSwingHighIndex = i;
    }
    if (swingLows[i] !== null) {
        lastSwingLowIndex = i;
    }

    if (lastSwingHighIndex !== null && close[i] > high[lastSwingHighIndex]) {
        bullishMSB[i] = high[lastSwingHighIndex];
        bullishMSBLines.push({
            startIndex: lastSwingHighIndex,
            breakIndex: i,
            value: high[lastSwingHighIndex]
        });
        lastSwingHighIndex = null;
    }

    if (lastSwingLowIndex !== null && close[i] < low[lastSwingLowIndex]) {
        bearishMSB[i] = low[lastSwingLowIndex];
        bearishMSBLines.push({
            startIndex: lastSwingLowIndex,
            breakIndex: i,
            value: low[lastSwingLowIndex]
        });
        lastSwingLowIndex = null;
    }
}

// Function to create a line
const createLine = (startIndex, breakIndex, value, color, isBullish, lineIndex) => {
    const lineData = series_of(null);
    const endIndex = Math.min(breakIndex + lineLength, close.length);
    for (let i = startIndex; i < endIndex; i++) {
        lineData[i] = value;
    }
    const paintedLine = paint(lineData, {
        color: color,
        name: `${isBullish ? 'Bullish' : 'Bearish'} MSB ${lineIndex}`
    });

    // Place label at the swing high/low candle
    const labelIndex = isBullish ? startIndex : startIndex;
    paint_label_at_line(paintedLine, labelIndex, 'MSB', {
        color: color,
        vertical_align: isBullish ? 'top' : 'bottom'
    });
};

// Paint MSB lines and labels
const currentIndex = close.length - 1;
const msbLookbackStartIndex = Math.max(0, currentIndex - msbLookback);
bullishMSBLines.filter(line => line.breakIndex >= msbLookbackStartIndex).forEach((line, index) => {
    createLine(line.startIndex, line.breakIndex, line.value, bullishColor, true, index);
});
bearishMSBLines.filter(line => line.breakIndex >= msbLookbackStartIndex).forEach((line, index) => {
    createLine(line.startIndex, line.breakIndex, line.value, bearishColor, false, index);
});Traders also viewed