Indicator Disclaimer
|
Report this indicator
Disclaimer
All information shown on this page is for illustrative purposes only and should not be construed as investment, financial, market or other advice. Any information shown on this page that purports to be based upon past or current market conditions may not be complete, timely or accurate and, in any event, is not predictive of future outcomes.
Report This Indicator
(Dorsey relative strength)
Compares a security’s price to the S&P 500, showing if it’s outperforming or underperforming the market.
describe_indicator('Dorsey Relative Strength', 'lower', { decimals: 3, shortName: 'RSD'});

const indexSymbol = input.symbol('Index');

// Convert current resolution to a higher one that contains at least double the amount of candles
const higherResolution = { 1: '2', 2: '4', 3: '6', 4: '10', 5: '10', 6: '12', 10: '30', 12: '30',	15: '30', 30: '60', 45: '90', 60: '120', 65: '240', 90: '240', 120: '240', 240: '1440', 1440: 'D',	D: 'W', W: 'M', M: 'Q', Q: 'Y', Y: 'Y' }[constants.resolution];

const indexData = await request.history(indexSymbol, higherResolution, {	ext_session: constants.session.lengthMinutes == constants.ext_session.lengthMinutes});

const indexClose = land_points_onto_series(indexData.time, indexData.close, time, 'ge');

const rsd = mult(div(close, interpolate_sparse_series(indexClose, 'constant')), 100);

paint(rsd, { name: 'Line', color: 'grey', thickness: 5 });
Traders also viewed
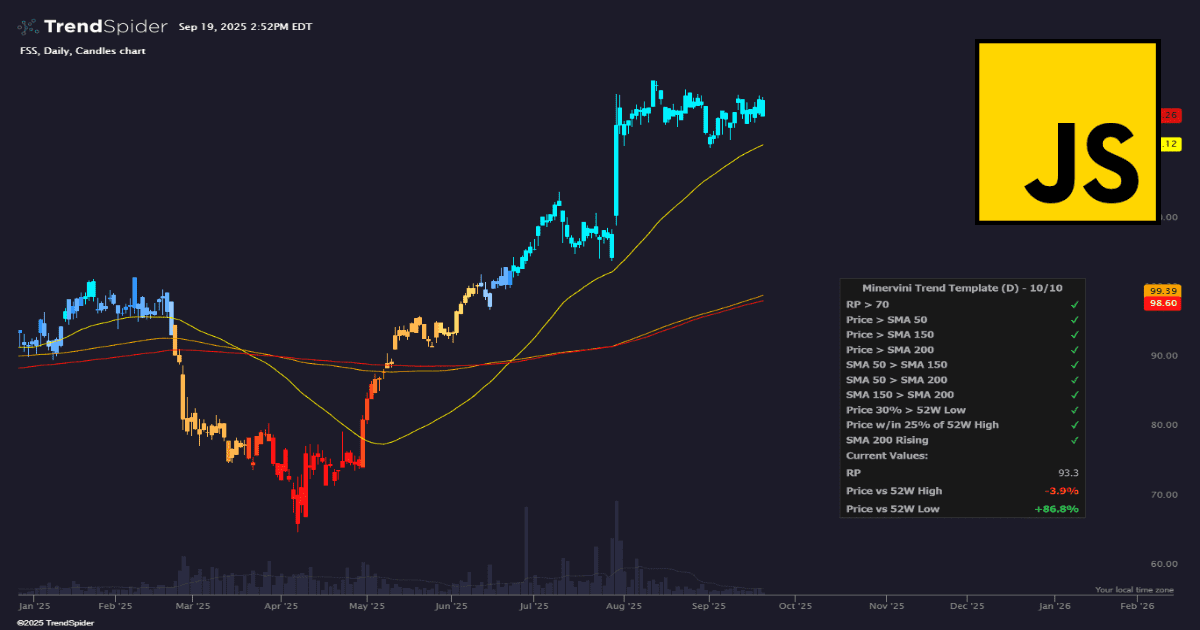
Minervini Trend Template
This indicator applies Mark Minervini’s exact Trend Template, a set of technical conditions used to identify true market leaders in strong, healthy uptrends. Each candle is color-coded based on how...
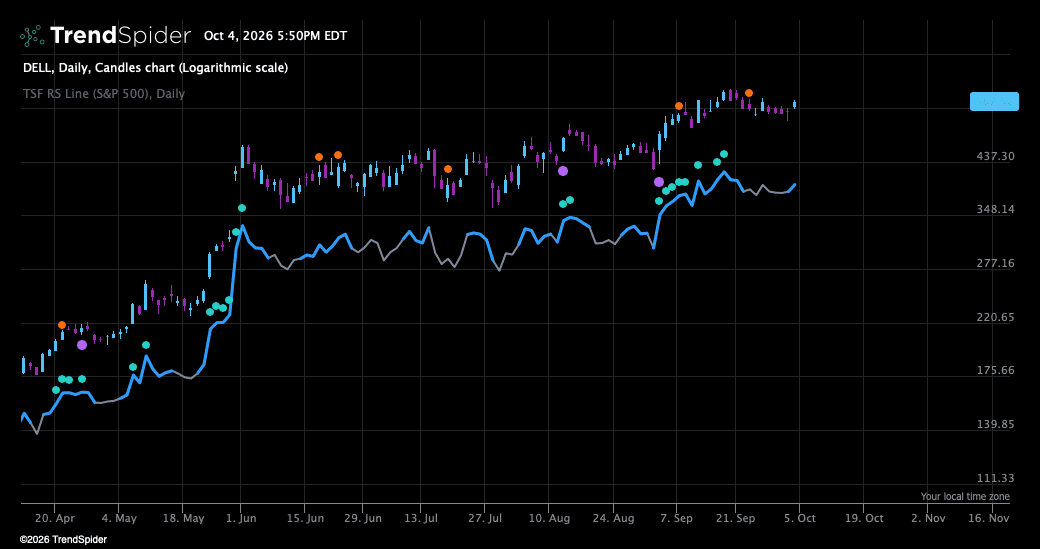
The Setup Factory RS – Line
TSF RS Line The TSF RS Line shows a stock's relative strength against a benchmark and marks three events on the chart. It is built for US stocks on the...
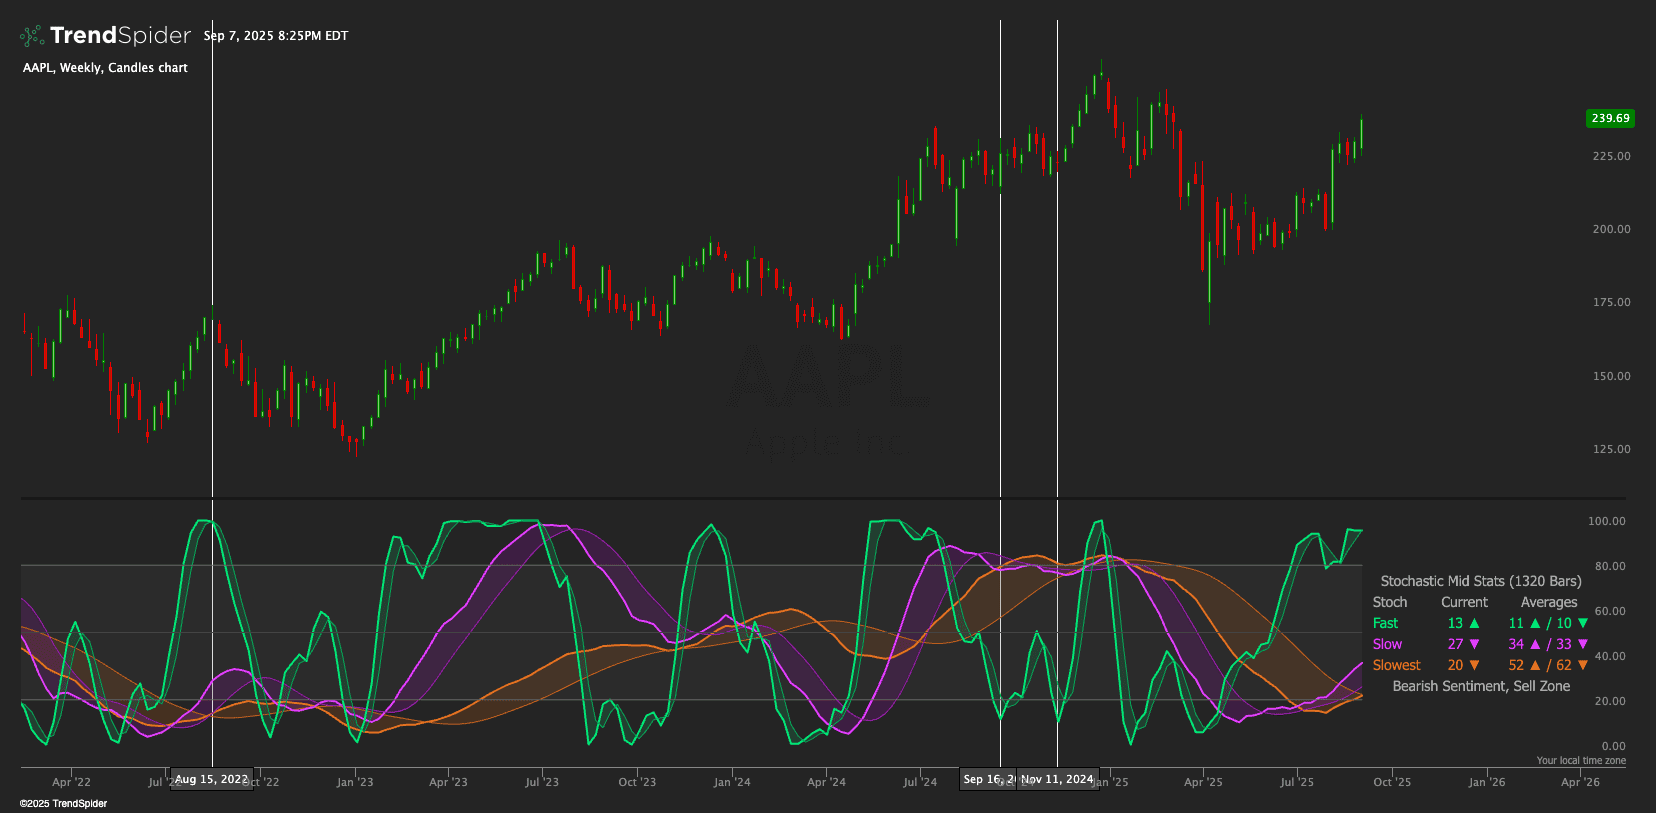
Triple Stochastic RSI
General Idea This indicator is a Triple Stochastic RSI #TSBuild25, which combines three Stochastic RSI indicators with different periods to provide a comprehensive view of market momentum and potential trend...
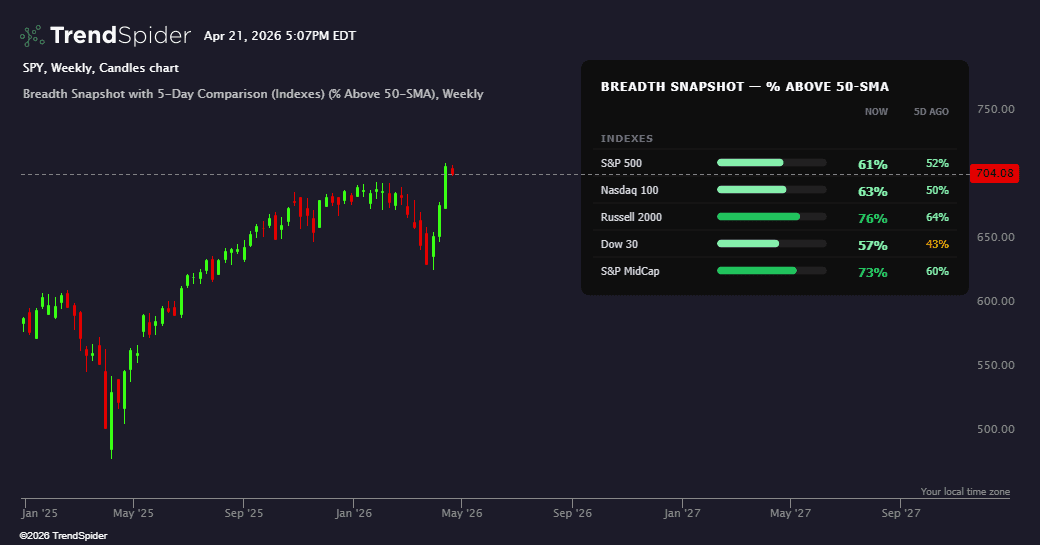
Breadth Snapshot with 5-Day Comparison (Indexes)
General Idea This indicator creates a visual dashboard that displays market breadth metrics for major stock indexes (S&P 500, Nasdaq 100, Russell 2000, Dow 30, and S&P MidCap). Market breadth...
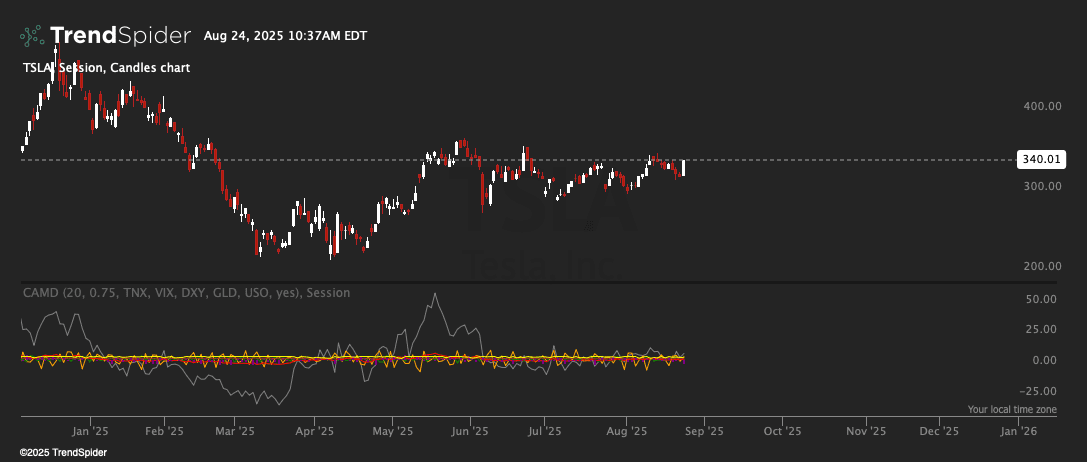
Cross-Asset Momentum Divergence
Cross-Asset Momentum Divergence (CAMD) What it is A lower-pane, macro-aware momentum dashboard that compares your symbol’s rolling momentum to cross-asset proxies (rates, USD, commodities, volatility). It flags when price strength/weakness is...
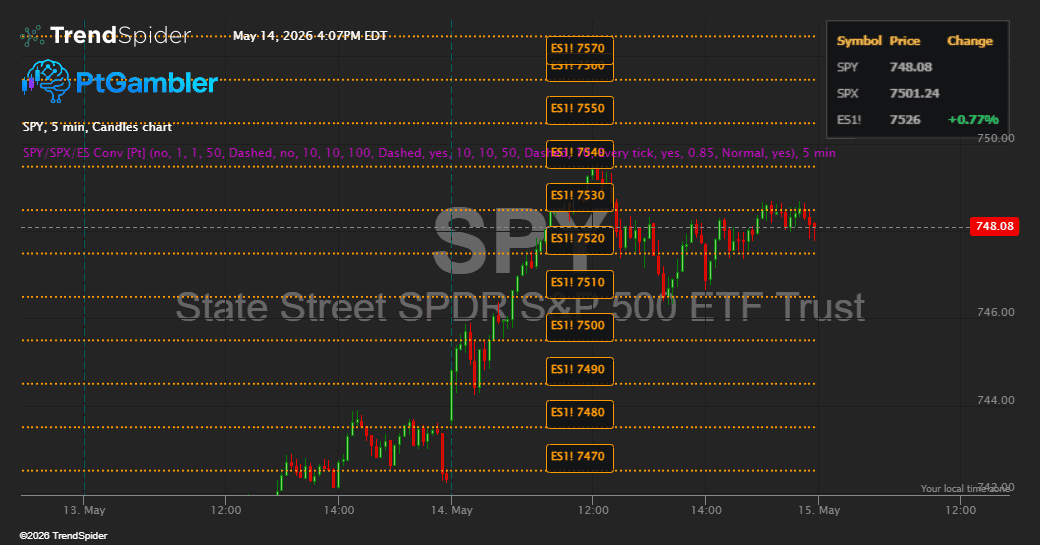
SPY SPX ES Price Converter [Pt]
SPY/SPX/ES Price Converter Indicator General Idea This indicator creates a visual price conversion tool that shows you how price levels from one S&P 500-related instrument translate to another. Think of...