Trend Direction
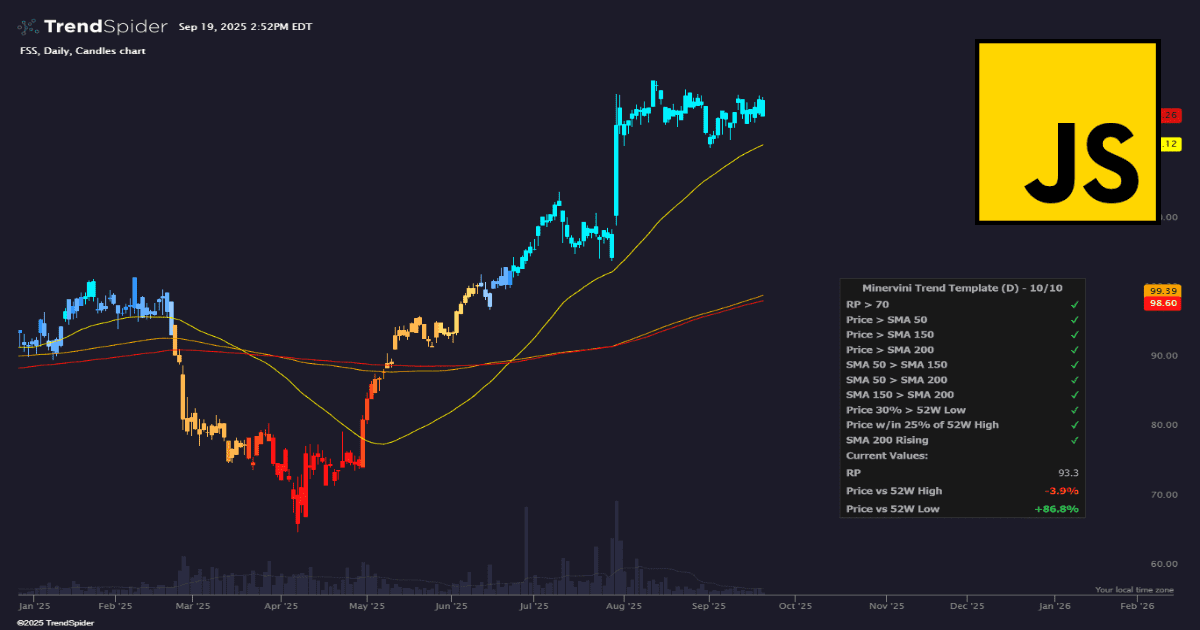
Minervini Trend Template
This indicator applies Mark Minervini’s exact Trend Template, a set of technical conditions used to identify true market leaders in strong, healthy uptrends. Each candle is color-coded based on how...
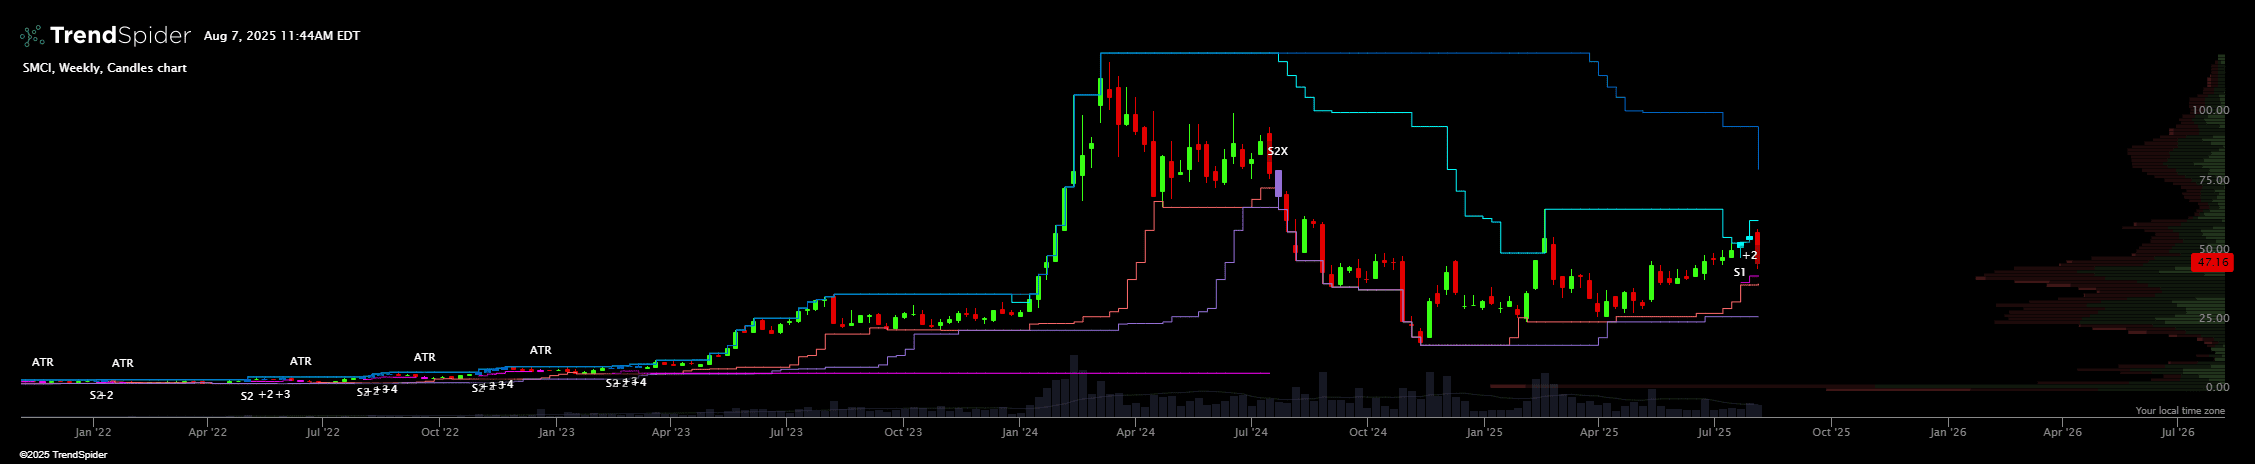
Turtle Trading Strategy (Long-Only)
The Turtle Trading Strategy indicator brings the classic Turtle breakout system to TrendSpider. It plots the two breakout channels: the 20-day high for System 1 and the 55-day high for...
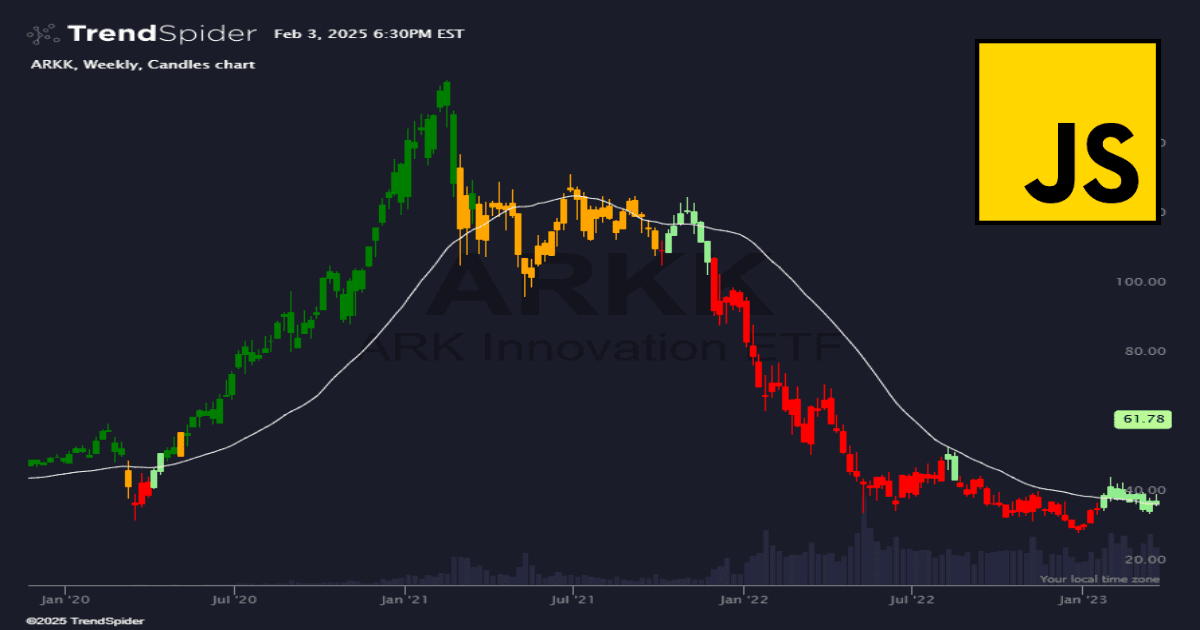
Weinstein Stage Analysis
The Weinstein Stage Analysis indicator helps you instantly identify where a stock sits in Stan Weinstein’s classic four-stage cycle. Built around the 30-week moving average, this tool maps accumulation, advancing...
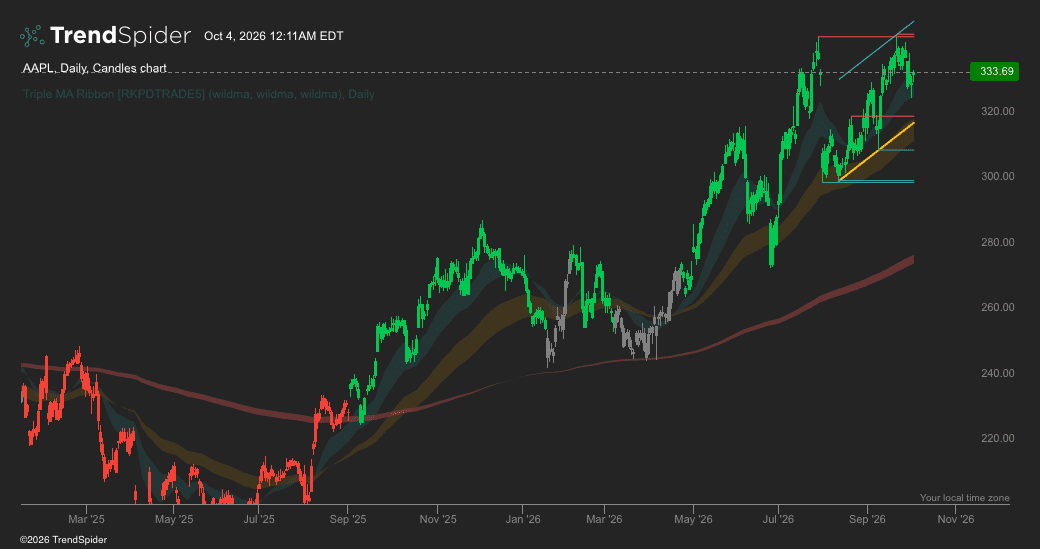
Triple MA Ribbon [RKPDTRADE5]
Triple MA Ribbon [RKPDTRADE5] is a multi-layer trend and market-structure indicator designed to provide a clean visual perspective of changing market conditions. The indicator combines multiple trend horizons with dynamic...
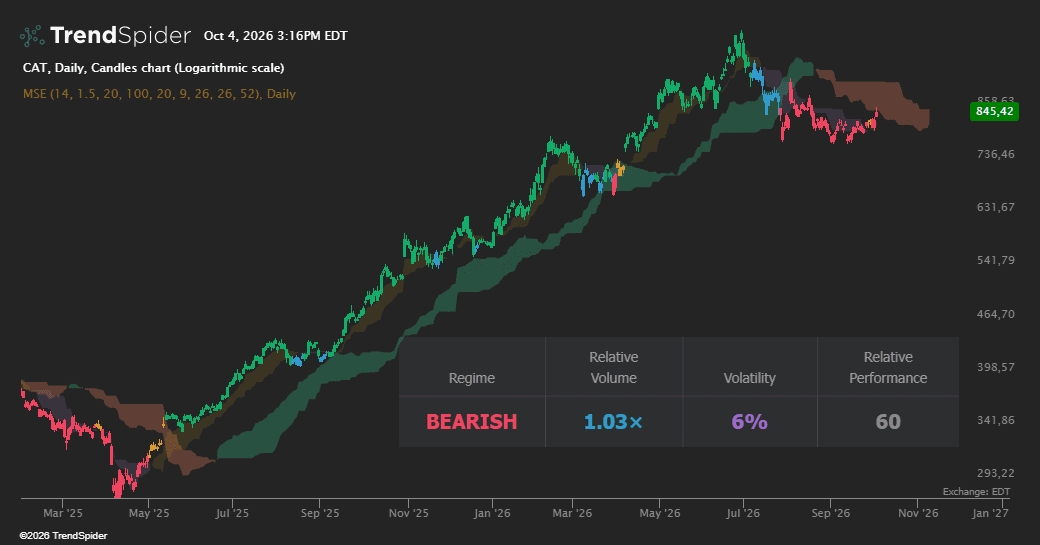
Market State Engine
Market State Engine See market direction, weakening conditions, and conflicting signals at a glance. Market State Engine brings together market structure, Ichimoku clouds, and meaningful candle colors in a clean...
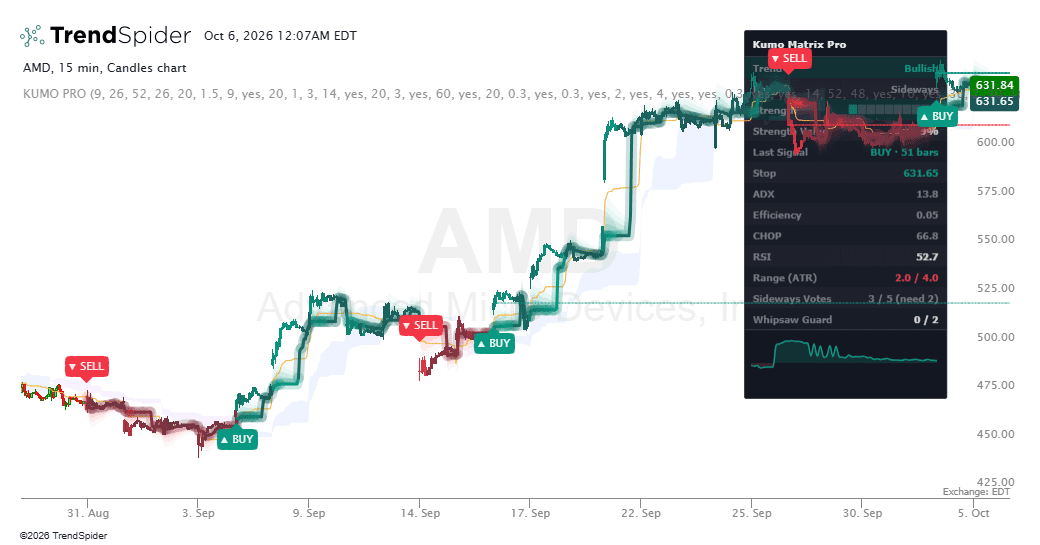
Kumo matrix
Kumo Matrix Pro is an institutional-grade trend-following signal engine designed to solve the two biggest challenges in technical trading: false breakouts in sideways markets and rapid signal whipsaws (flip-flops). By fusing Ichimoku Kumo Structure, Heikin-Ashi Momentum, ATR...
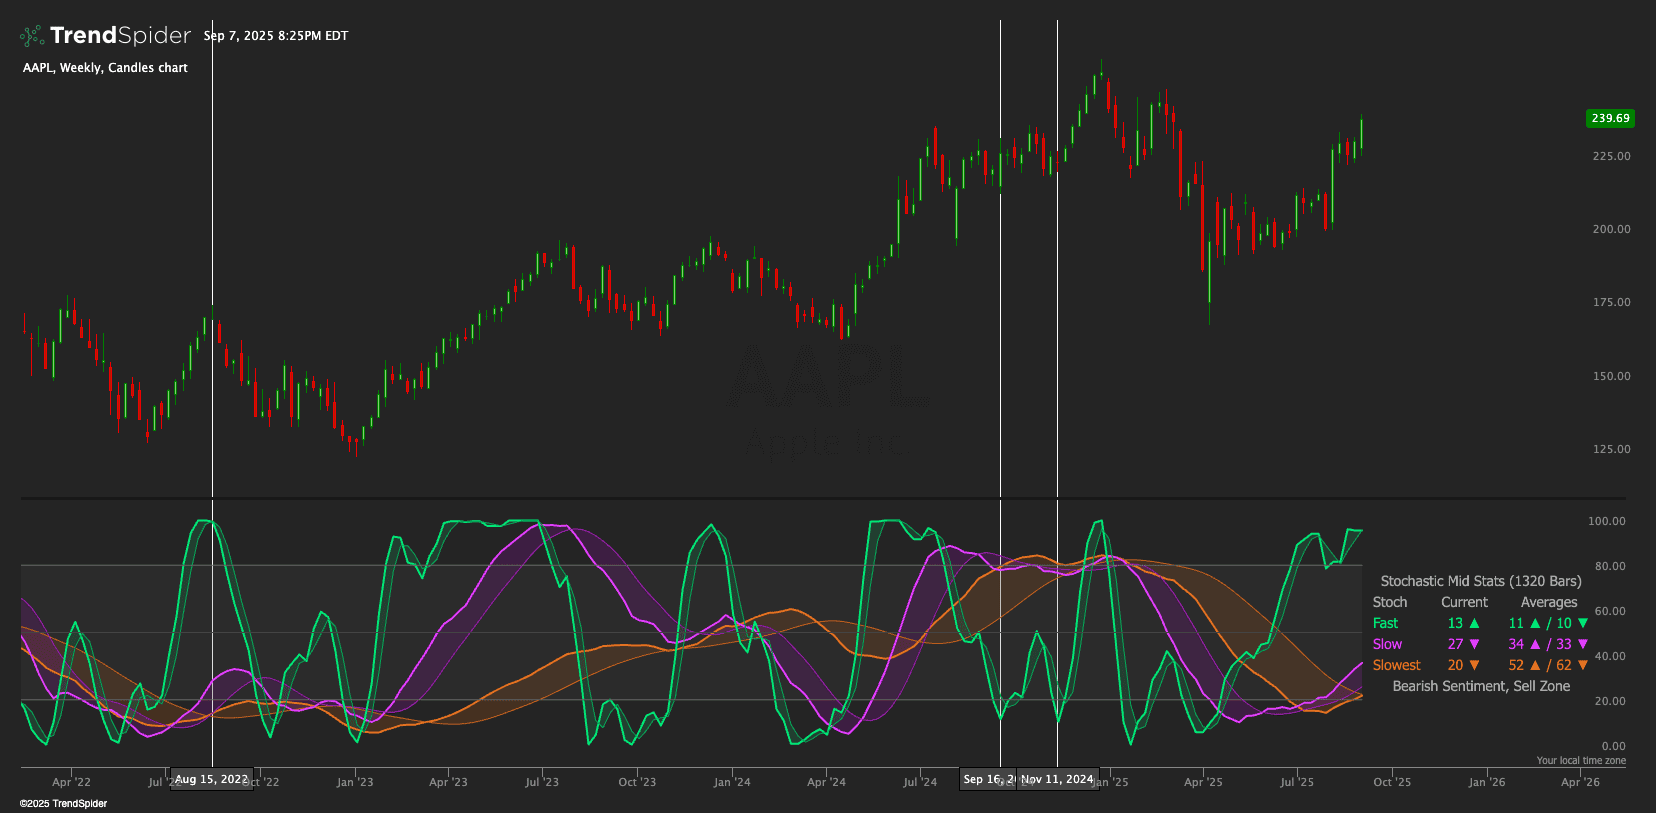
Triple Stochastic RSI
General Idea This indicator is a Triple Stochastic RSI #TSBuild25, which combines three Stochastic RSI indicators with different periods to provide a comprehensive view of market momentum and potential trend...
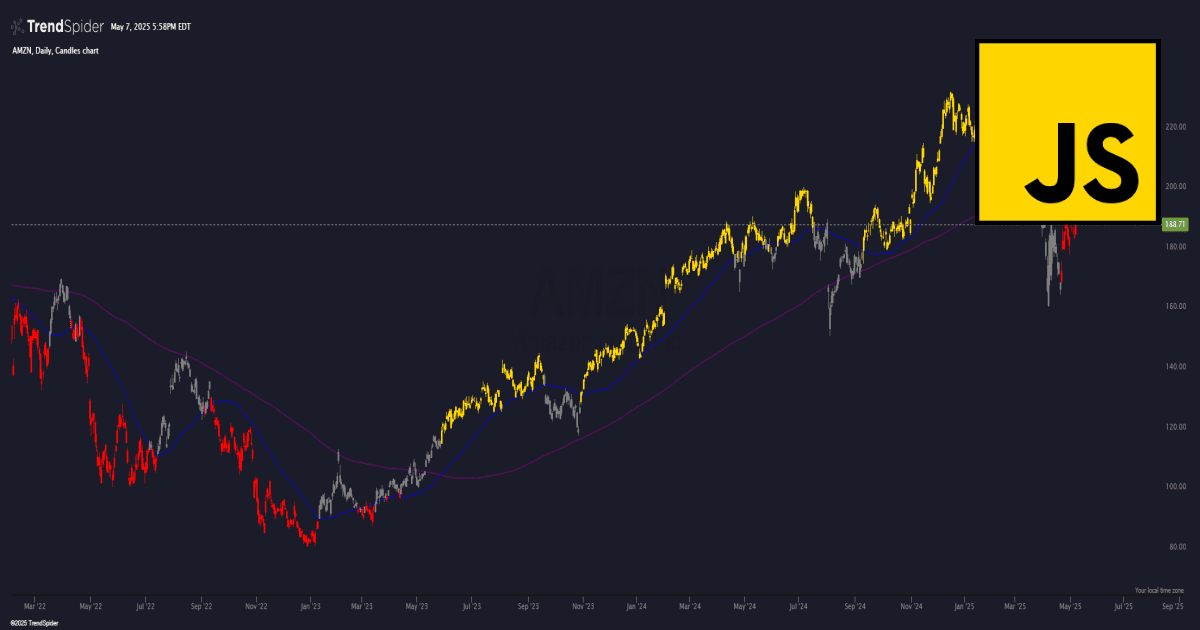
Golden / Death Cross Painter
This indicator paints candles gold when the 50 SMA crosses above the 200 SMA with the price closing above both, signaling a bullish trend. It paints candles red when the...
Sector Rotation Chart
General Idea This indicator creates a Sector Rotation Chart that visualizes how multiple sectors (or any symbols) are performing relative to a benchmark over time. The core concept is displaying...

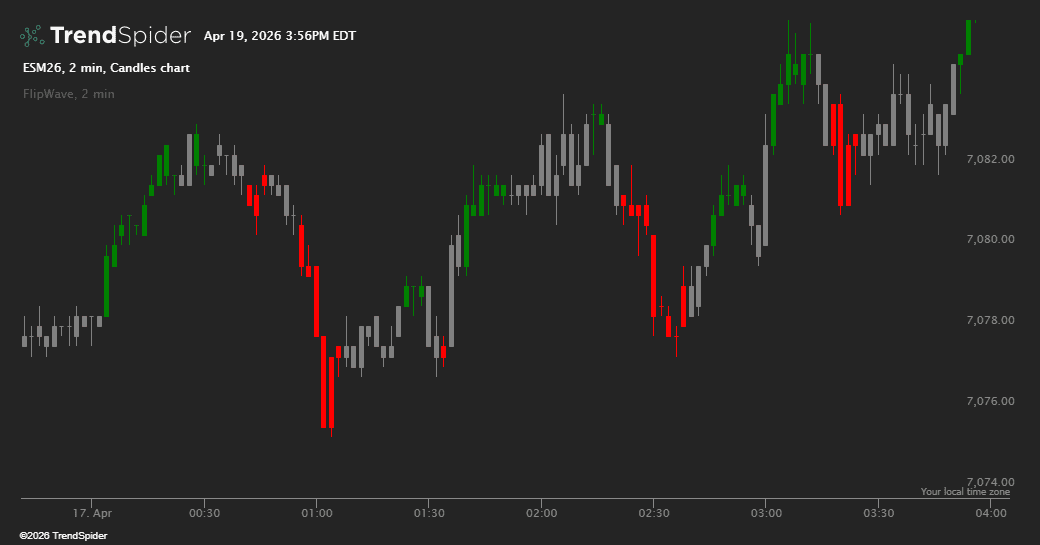
FlipWave
FlipWave is a micro‑trend engine that detects fast hierarchy shifts using multiple moving average and marks the exact bar where momentum flips from bearish to bullish (and vice‑versa). It colors...
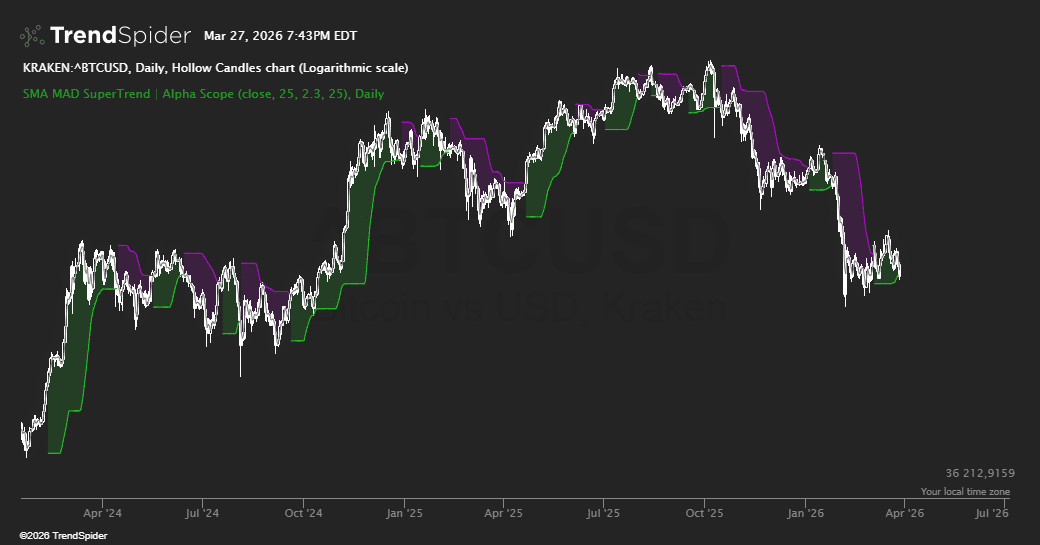
SMA MAD SuperTrend | Alpha Scope
The SMA MAD SuperTrend is an trend-following indicator designed to help traders identify potential trend directions and reversals using a unique combination of a Simple Moving Average (SMA), Mean Absolute...
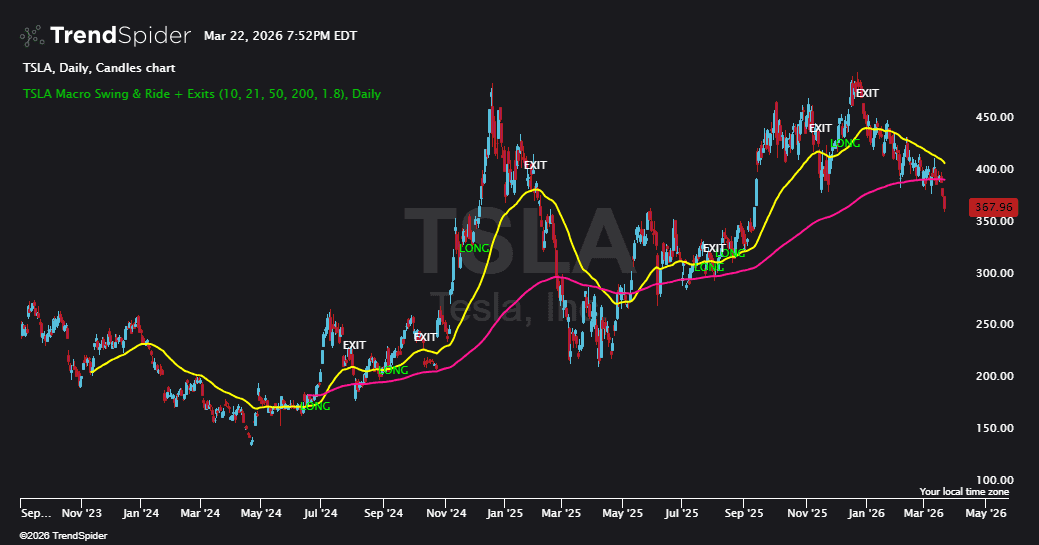
TSLA Macro Swing & Ride + Exits
This script, TSLA Macro Swing & Ride + Exits, is the result of extensive fine-tuning specifically for high-volatility assets like Tesla. It is designed to capture massive trend expansions while...