Trading System
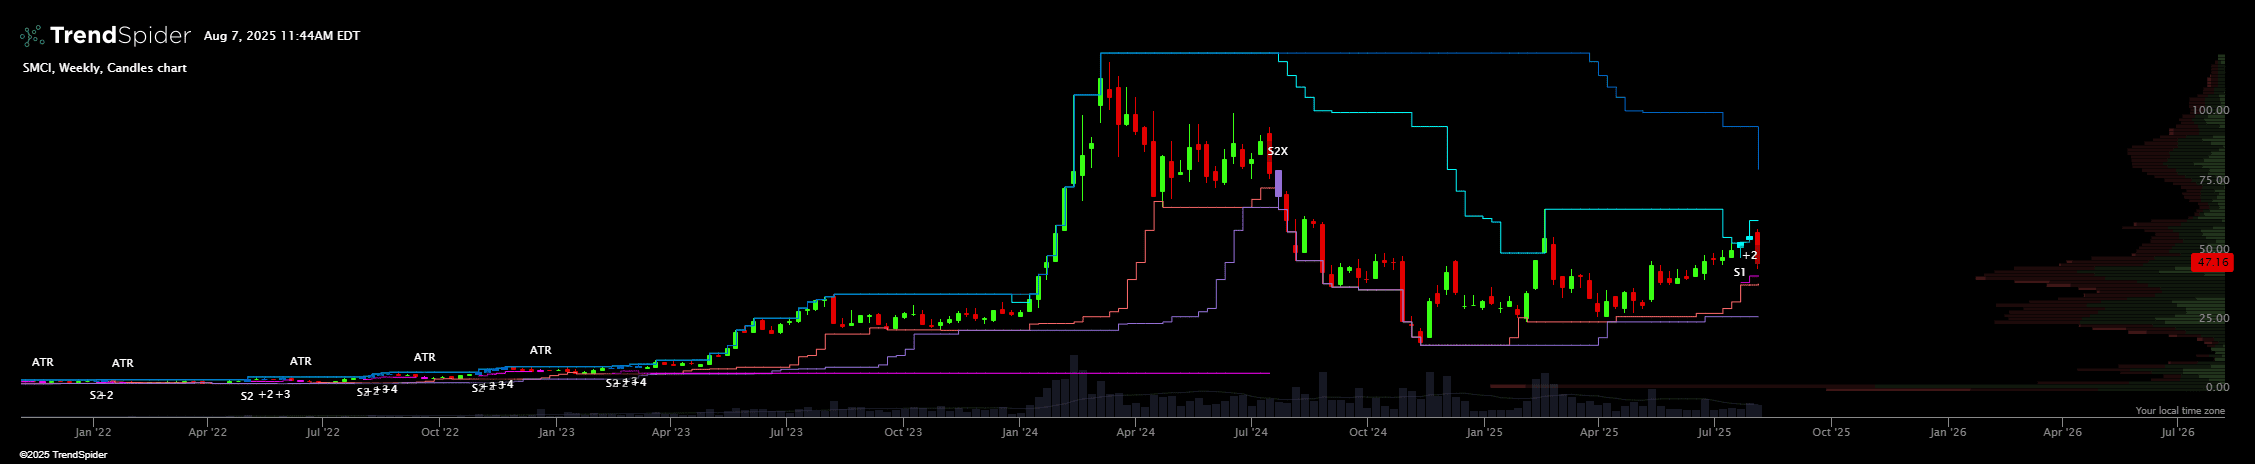
Turtle Trading Strategy (Long-Only)
The Turtle Trading Strategy indicator brings the classic Turtle breakout system to TrendSpider. It plots the two breakout channels: the 20-day high for System 1 and the 55-day high for...
Minervini Trend Template
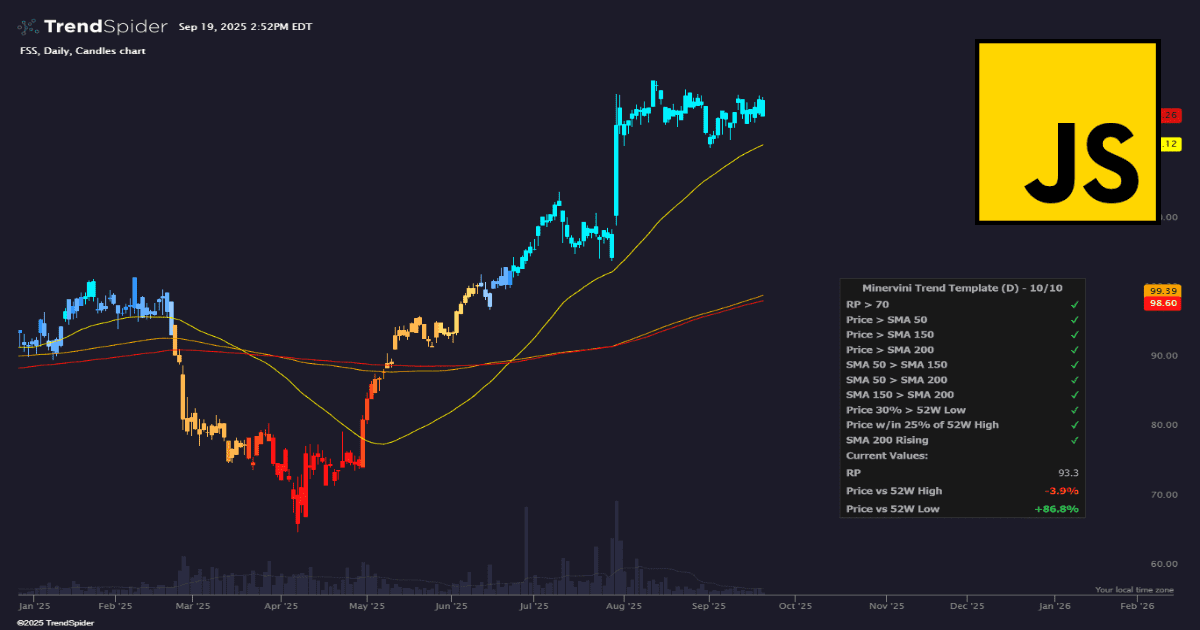
This indicator applies Mark Minervini’s exact Trend Template, a set of technical conditions used to identify true market leaders in strong, healthy uptrends. Each candle is color-coded based on how...
Chande paraBOB
Core Concept: We integrate the adaptive breakout channel with parabolic accelerating exits to create a powerful indicator that mimics a trading system. Explaining the Intuition Please review the following: https://trendspider.com/trading-tools-store/indicators/68a351-chande-breakout-buddy-adaptive-donchian-channel/...

Chande paraBOB+
Core Concept: We integrate the adaptive breakout channel with parabolic accelerating exits to create a powerful indicator that mimics a trading system. This indicator can have infinitely many exits because...

Triple Stochastic RSI
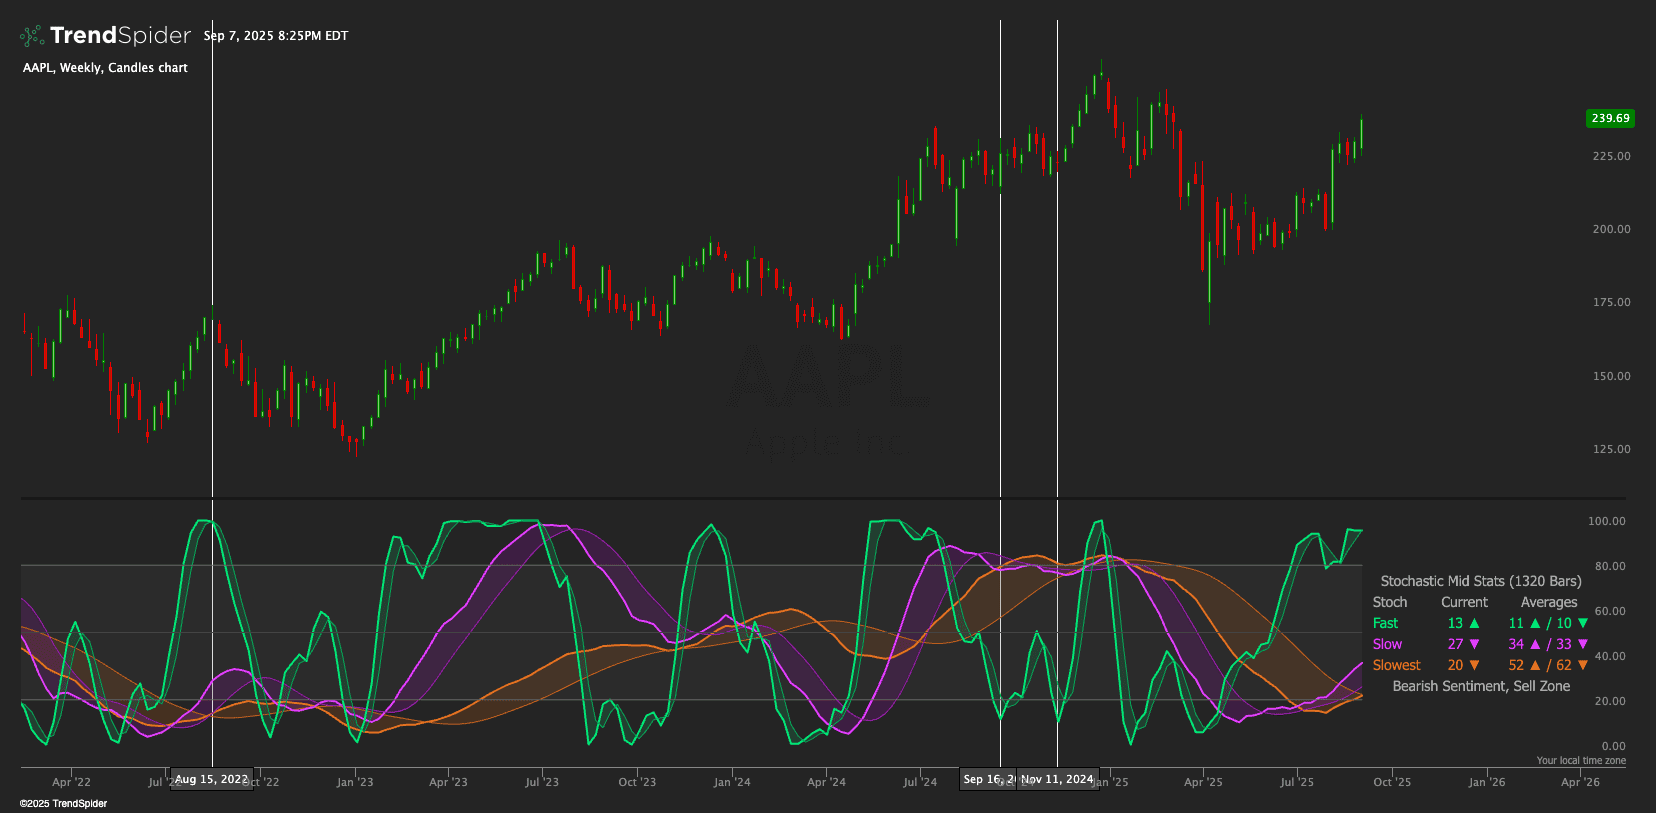
General Idea This indicator is a Triple Stochastic RSI #TSBuild25, which combines three Stochastic RSI indicators with different periods to provide a comprehensive view of market momentum and potential trend...
Chande ARCH-AP
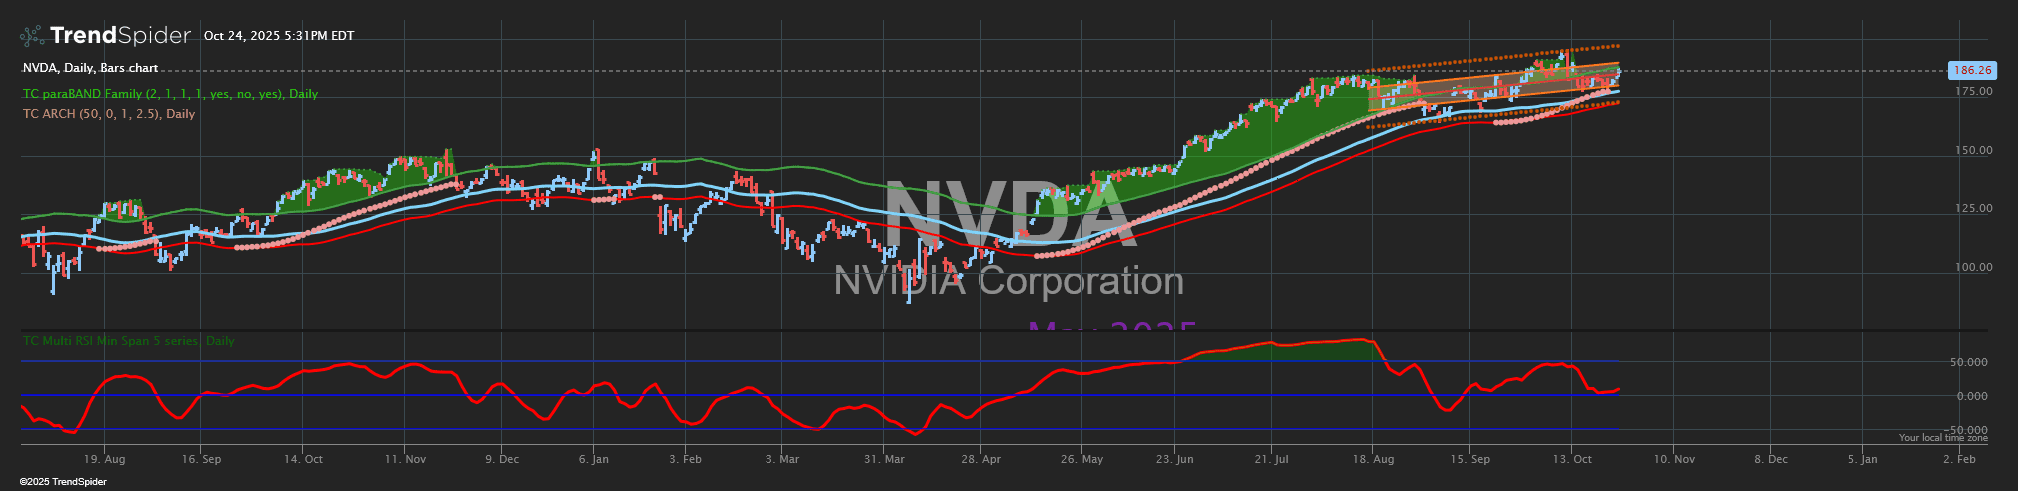
Perfect for discretionary traders, this tool automatically draws a 5-line price channel on the chart over a user-specified length. Linear regression is used to find the best-fit line, and volatility...
RSI divergences – Libertus
█ OVERVIEW This script will help you track divergences in an easy, clean, and very visible way. It works with the Relative Strength Index (RSI) as the underlying indicator and functions...

Ripster MTF Clouds
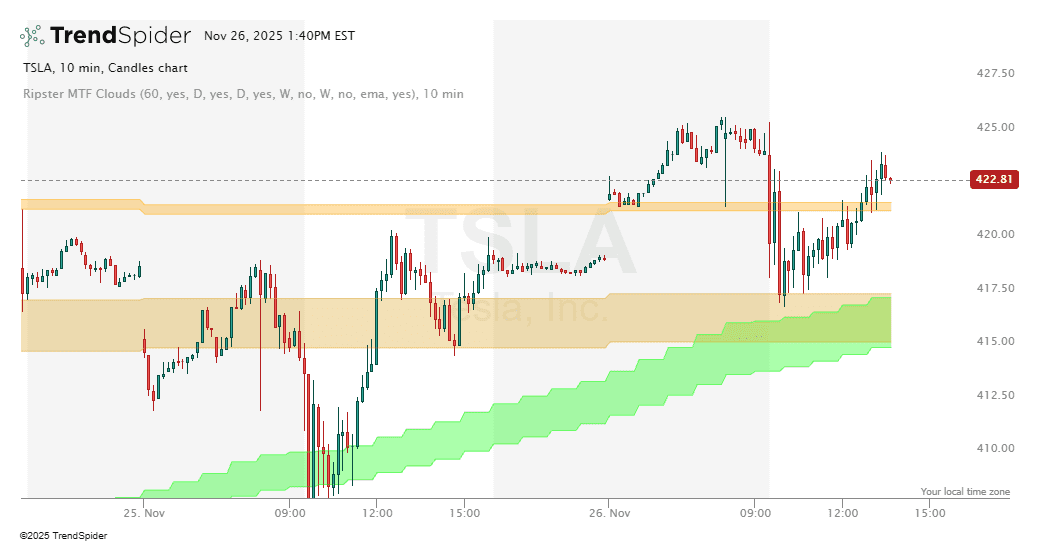
Ripster MTF Clouds" refers to a specific type of technical trading indicator that shows Exponential Moving Average (EMA) "clouds" from higher time frames on a current chart. This helps traders...
Relative Rotation Histogram (RRH)
Relative Rotation Histogram (RRH) created for TrendSpider Hackathon 2025 #TSBuild25 Relative Rotation Histogram (RRH) This indicator builds on Relative Rotation Graph (RRG) logic by combining RS-Ratio (relative strength trend) and...

Futures pre-market range by SmallSteps
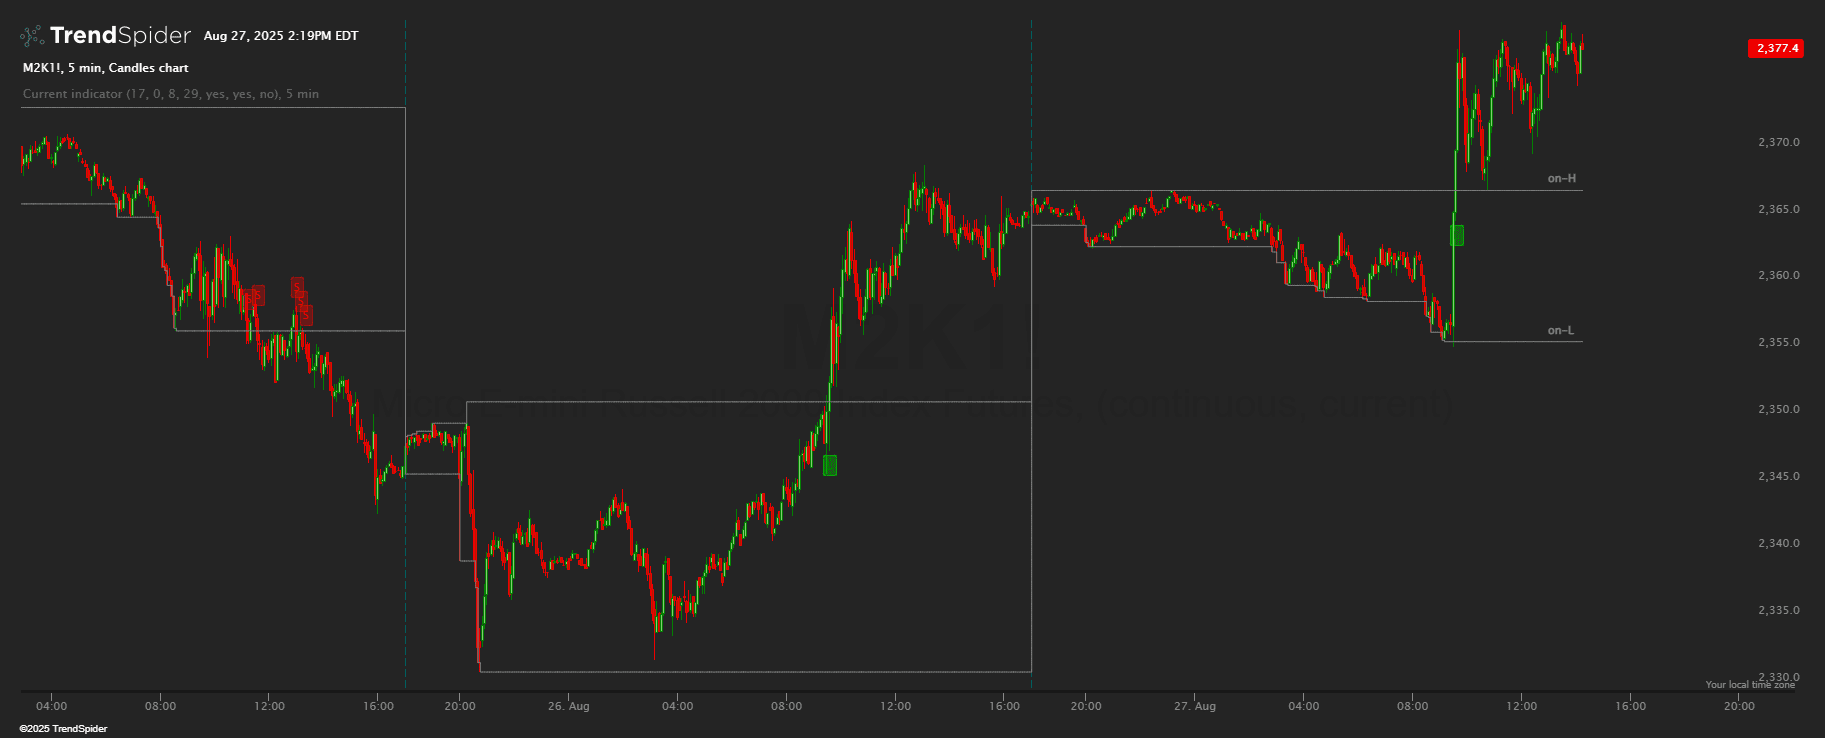
This indicator is designed for use with futures contracts such as MES1!, MNQ1!, and M2K1!. It plots the high and low of the pre-market (overnight) session and optionally highlights the...
Futures Gap Labels by SmallSteps
This indicator is designed for use with futures contracts such as MES1!, MNQ1!, and M2K1!. This indicator colors the candles at two specific times each day (session start and session...

Market Structure Breaks
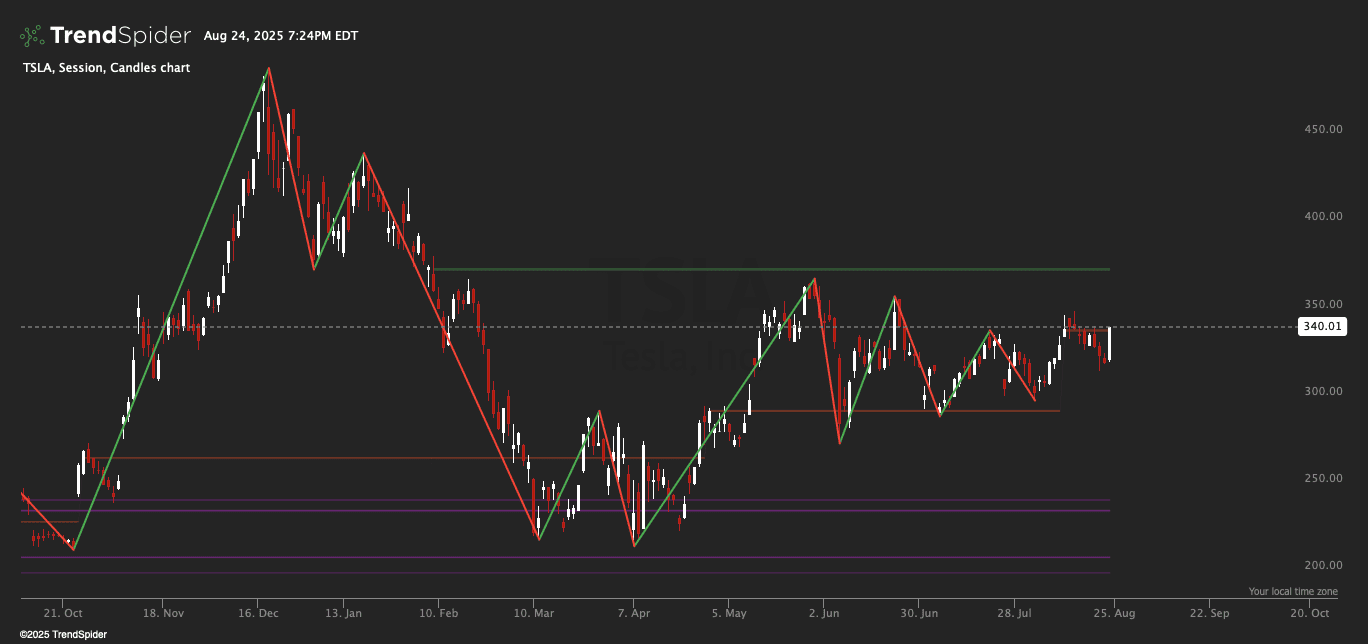
Market Structure Breaks (MSB) What it is? A price-pane detector of institutional market structure shifts using ZigZag swing analysis. Identifies when price breaks above recent swing highs (bullish break) or...