Disclaimer
All information shown on this page is for illustrative purposes only and should not be construed as investment, financial, market or other advice. Any information shown on this page that purports to be based upon past or current market conditions may not be complete, timely or accurate and, in any event, is not predictive of future outcomes.
Report This Indicator
(HTF Sweep & Shift Suite)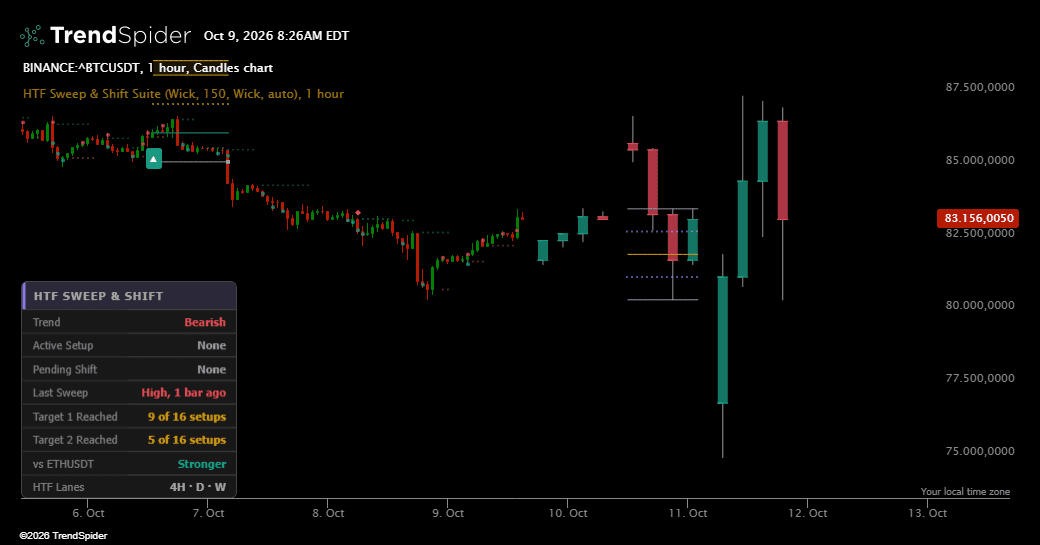
HTF Sweep & Shift Suite tracks the moment a market takes out a higher timeframe high or low, rejects it, and shifts direction. It watches the highs and lows of completed higher timeframe candles, marks every fresh sweep of those levels, follows the move that drove price into the sweep, and confirms a reversal only when price closes back through the origin of that move and then breaks the last swing. Each confirmed setup projects a ladder of target zones from its own range.
A second engine compares the chart with a correlated market, such as ETH with BTC, EUR with GBP or QQQ with SPY. When the chart closes beyond the previous period high or low while the correlated market cannot, the suite flags relative strength in that direction. Higher timeframe candles drawn to the right of price complete the picture. It works on crypto, forex, indices, stocks and futures.
🔹 Key Features
Higher Timeframe Sweeps
Small circles mark the bar where price runs through an untouched high or low of a completed higher timeframe candle. The higher timeframe follows the chart interval.
Pending Shift Levels
After a sweep, a dotted level shows the price the market must close back through to confirm a change in direction. It is drawn forward from the sweep and disappears when the setup confirms or expires.
Shift Signals
Badges mark confirmed reversals: the sweep is reclaimed, the shift level is broken on a close and the last swing is broken. With the trend filter on, only setups that agree with the longer term trend are signalled.
Target Ladder
Every confirmed setup draws its base level, its invalidation level, a first target and a shaded second target zone forward from the signal bar, while a third, extended target is tracked in the background. Reached targets are marked with small dots, an invalidated setup is marked with a small grey square, and a ladder that has done its job is retired. The active ladder is labelled T1 and T2 on the last bar.
Relative Strength
Diamonds mark the first close beyond the previous daily high or low (weekly on daily charts) while the correlated market fails to do the same. The comparison symbol is detected automatically for common pairs and can be set manually.
Higher Timeframe Candles
The latest candles of up to five higher timeframes are drawn as compact candle lanes to the right of the last bar, from the nearest timeframe to the slowest one, with a small legend naming each lane. The main context lane also shows the previous candle high, low, quarter and midpoint levels.
Dashboard
A compact panel in the lower left corner shows the longer term trend side, the active setup and its targets, any pending shift, the last sweep, how many past setups reached their first and second targets, today's behaviour against the correlated market and the lane timeframes.
No Repainting
Sweeps, pending levels, signals and target ladders are calculated from data available on each bar and drawn forward only. The candle lanes always show the latest higher timeframe candles, including the one still forming.
Settings
Setup: Sweep Uses chooses wick or close for sweeps, Trend Filter and Trend Length control trend alignment.
Targets: Invalidation Uses chooses wick or close for invalidation.
Comparison: Comparison Symbol accepts auto or any ticker.
Display: every layer can be switched off without changing any signal.
Colors: Bullish Color, Bearish Color, Target Color and Range Color.
Built In Signals
Bullish Shift and Bearish Shift: a confirmed reversal setup.
Sweep Low and Sweep High: a fresh sweep of a higher timeframe low or high.
Target Reached and Setup Invalidated: the active ladder reached a target or failed.
Relative Strength Up and Relative Strength Down: the chart broke the previous period high or low while the correlated market held.
Traders also viewed