Disclaimer
All information shown on this page is for illustrative purposes only and should not be construed as investment, financial, market or other advice. Any information shown on this page that purports to be based upon past or current market conditions may not be complete, timely or accurate and, in any event, is not predictive of future outcomes.
Report This Indicator
(The Setup Factory MA Compression Shakeout)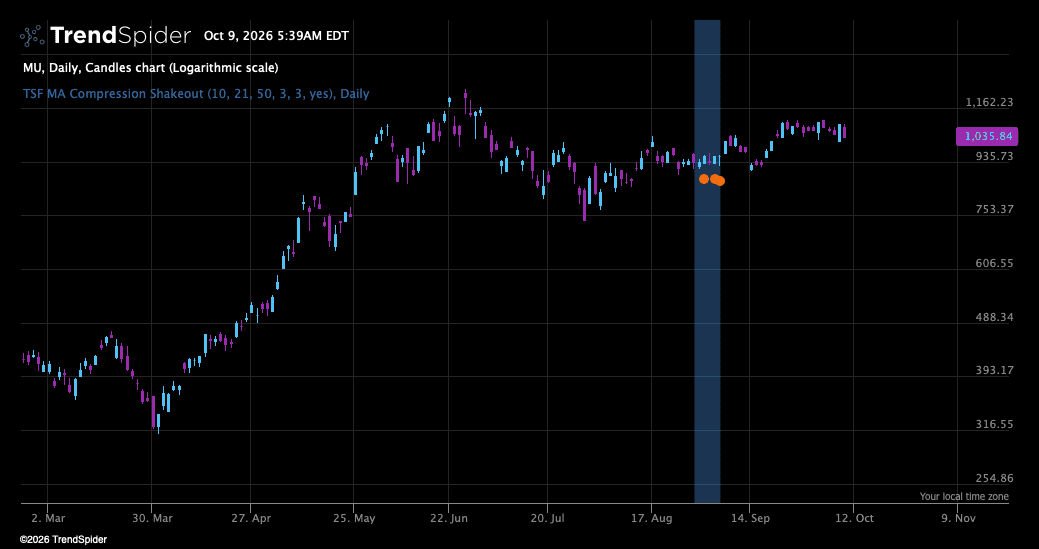
Shades the chart while a stock's key moving averages are compressed and price is sitting close to them, and marks the days that shake out below the averages and close back above. Before a stock advances off this tight spot, it often makes a shakeout through key MAs before pushing higher.
WHAT IT SHOWS
- Compression zone: a blue shade while the 10 SMA, 21 EMA and 50 SMA are within 3% of each other and the close is within 3% of the 50 SMA, above or below it.
- Shakeout dot: an orange dot under the candle when, inside a zone, the low is below both the 21 EMA and the 50 SMA and the close is back above both.
SETTINGS
- Fast SMA, EMA and slow SMA lengths: 10, 21 and 50 by default, all adjustable.
- Compression (%): how close the three averages must be to each other. The gap between the highest and the lowest average is measured against the closing price.
- Max % from slow SMA: how far the close may be from the slow SMA.
- Shakeout dot: on or off.
HOW TO USE IT
A zone shows where the averages have come together and price is resting near them. It is an area of interest, not a direction: the shade appears whenever the averages are tight, also when price is below them. The dot shows a day when price undercut the averages and closed back above them.
For information and education only. Not investment advice.
Traders also viewed