Disclaimer
All information shown on this page is for illustrative purposes only and should not be construed as investment, financial, market or other advice. Any information shown on this page that purports to be based upon past or current market conditions may not be complete, timely or accurate and, in any event, is not predictive of future outcomes.
Report This Indicator
(KST Ribbon [RKPDTRADE5])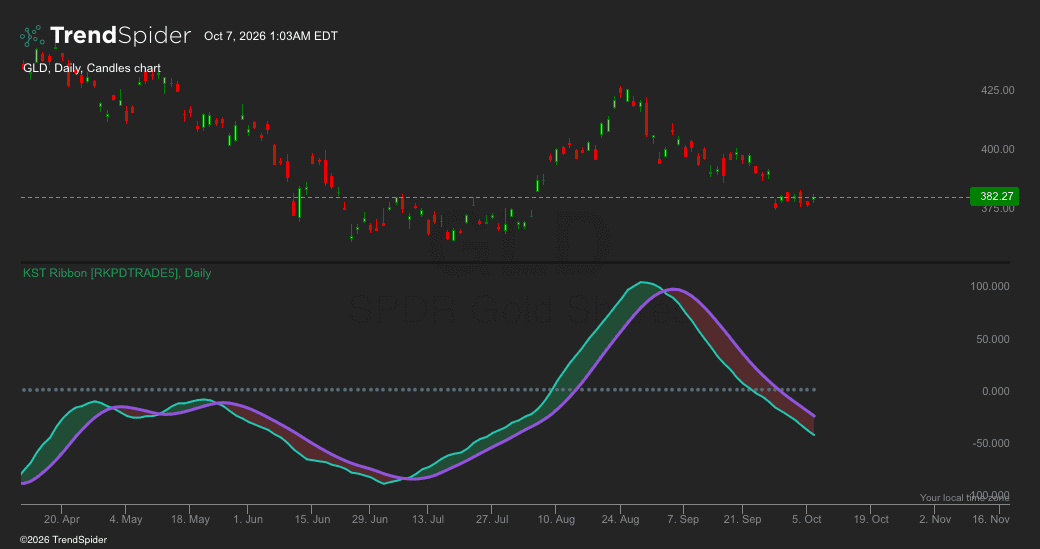
KST Ribbon [RKPDTRADE5] is a momentum and trend-confirmation oscillator designed to make shifts in market momentum easier to recognize visually.
The indicator combines multiple smoothed Rate of Change calculations across different lookback periods to measure both shorter- and longer-term momentum. A signal average is then used to create a dynamic ribbon that clearly displays changes in momentum direction.
How to Read It
- Green Ribbon – Bullish momentum is dominant as KST moves above its signal line.
- Red Ribbon – Bearish momentum is dominant as KST moves below its signal line.
- Ribbon Transition – A change between green and red represents a momentum crossover and may indicate an emerging directional shift.
- Zero Line – Helps identify whether overall momentum is operating in positive or negative territory.
The ribbon is designed to simplify momentum analysis without requiring traders to constantly interpret two crossing lines. It can be used across different symbols and timeframes and may be particularly useful when combined with price structure, support/resistance, volume, and broader trend analysis.
Explore My Premium RKPDTRADE5 Indicators
For traders looking for additional market analysis tools, check out my premium RKPDTRADE5 indicators available on TrendSpider.
My premium indicators are designed to complement one another by analyzing different areas of market behavior, including trend direction, momentum, swing structure, support and resistance, volume activity, and potential market transitions.
Combining complementary RKPDTRADE5 tools can provide a broader view of market conditions rather than depending on a single indicator or signal.
Check out my profile for the complete collection of premium RKPDTRADE5 indicators.
Disclaimer
This indicator is provided for educational and informational purposes only and does not constitute financial, investment, trading, or professional advice. Nothing generated by this indicator should be interpreted as a recommendation to buy, sell, or hold any security, cryptocurrency, futures contract, forex pair, or other financial instrument.
No technical indicator can predict future market movements or guarantee profitable results. False signals, delayed signals, whipsaws, and trading losses can occur under any market condition. Historical performance does not guarantee future results.
Always conduct your own research, consider multiple forms of analysis, use appropriate risk management, and make trading decisions according to your own financial situation, objectives, experience, and risk tolerance.
TSBuild26
Traders also viewed