Disclaimer
All information shown on this page is for illustrative purposes only and should not be construed as investment, financial, market or other advice. Any information shown on this page that purports to be based upon past or current market conditions may not be complete, timely or accurate and, in any event, is not predictive of future outcomes.
Report This Indicator
(Valuation Floors & Ceilings)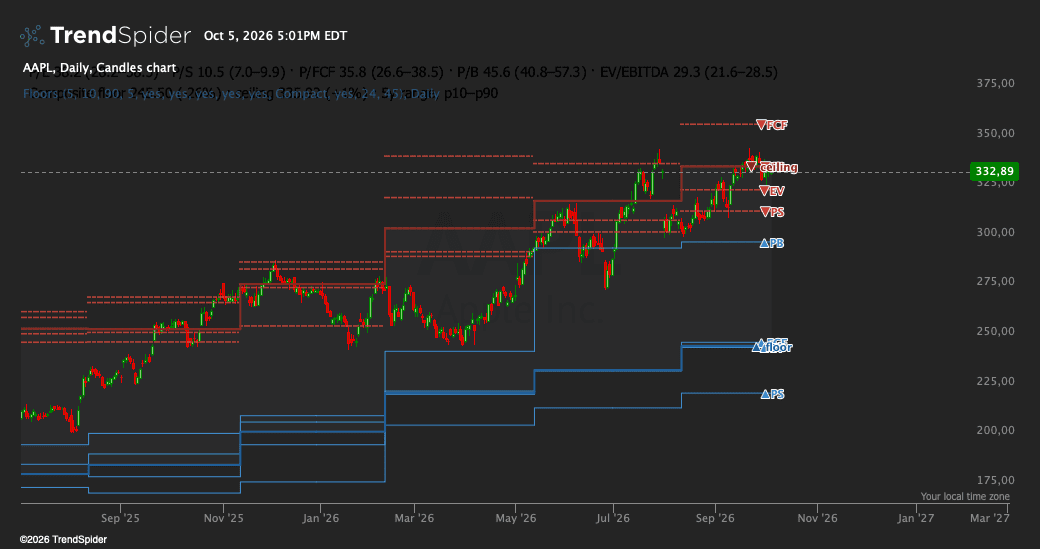
At what price does this stock get cheap, and where does it get expensive? Ten valuation levels on the chart, built from the stock's own history: the lowest and highest multiple it has traded at over five years on P/E, P/S, P/FCF, P/B and EV/EBITDA, each converted into a price for today's fundamentals. Support and resistance made of fundamentals, stepping at every report. Free. #TSBuild26
A normal ratio indicator draws P/E and leaves you to figure out what 28 means. I wanted the answer as a price. So this one flips the question: for each multiple it takes the 10th and 90th percentile the stock has traded at over the lookback, then multiplies by the current trailing-twelve-month figure per share. At 142 the stock is as cheap as it's been on cash flow in five years; at 210 as expensive as it's been on sales. Levels you can actually trade against, and they only move when the fundamentals do.
What You See on the Chart
Five floors in blue, solid stepped lines, one per multiple. Five ceilings in red, dotted. Each labelled at the last bar with an arrow and the metric: ▲PE is the P/E floor, ▼FCF the free cash flow ceiling.
A composite floor and ceiling drawn heavier, the median of whichever levels exist, with a light fill between them: the stock's own valuation band. Price below the composite floor is cheaper than it's been on most measures at once.
Levels only exist where the metric is positive. A loss-making company keeps its sales, book, cash flow and EBITDA levels and just loses the earnings one, so the composite still works. Every report is applied 45 days after period end, so nothing is drawn before it was knowable.
The summary panel shows each current multiple with its floor-to-ceiling range, plus the composite levels and how far price is from them.
The Signals
Several conditions for the Market Scanner, alerts and the Strategy Tester.
- Near a floor and Near a ceiling fire when price is within 5% of any level.
- Below composite floor and Above composite ceiling fire while price is outside the band.
- Reclaimed composite floor fires on the bar price crosses back above the floor.
- Below two or more floors fires when the stock is cheap on at least two measures at once.
How To Use It
Scan a watchlist for Below two or more floors on the daily and you get every name trading below its own five-year lows on multiple measures: a list to research, not a list to buy. Set Near a floor as an alert on a stock you like and you'll be told when it reaches a price where it has historically stopped falling. On a chart, a stock sitting at its composite ceiling with the P/E ceiling above and the P/S ceiling below is telling you which measure the market is stretching.
Lookback, percentiles and the near-level tolerance are inputs. Each multiple can be switched off, and the labels can be compact, full or off.
Built for the TrendSpider Hackathon 2026, Best Fundamental Analysis category. #TSBuild26
describe_indicator('Valuation Floors & Ceilings', 'price', {
	shortName: 'Floors',
	decimals: 'by_symbol',
	mainColorInheritFrom: 'composite_floor'
});

/*
	VALUATION FLOORS & CEILINGS
	---------------------------
	At what price does this stock become cheap, and at what price expensive?

	A ratio indicator draws P/E and leaves you to interpret it. This inverts
	the question. For five multiples (P/E, P/S, P/FCF, P/B, EV/EBITDA) it
	finds the lowest and highest multiple the stock has carried over your
	lookback, then converts each into a PRICE for today's fundamentals:

	    floor price   = low multiple  x  today's per-share metric
	    ceiling price = high multiple x  today's per-share metric

	Ten levels on the price pane, stepping at each report. "At 142 it is as
	cheap as it has been on cash flow in five years; at 210 as expensive as
	it has been on sales." Support and resistance made of fundamentals.

	A composite floor and ceiling (the median of the available levels) are
	drawn heavier with a fill between them: the stock's own valuation band.

	Levels only exist where the metric is positive, so a loss-making company
	keeps its sales, book and cash-flow levels and loses the earnings one.
	Every report is applied after a filing lag so nothing is drawn before it
	was knowable.

	Design rules followed:
	  - Every paint() / fill() / paint_overlay() / paint_label_at_line() /
	    register_signal() runs on every execution, with fixed names, in order.
	  - One value per candle. No colour arrays on gapped lines.
	  - No built-in names shadowed. Input labels under 28 characters.
*/

/* ========================== INPUTS ========================== */

const rangeGroup = input.group('Range');
const lookbackYears = rangeGroup.number('Lookback (years)', 5, { min: 1, max: 15 });
const floorPercentile = rangeGroup.number('Floor percentile', 10, { min: 1, max: 40 });
const ceilingPercentile = rangeGroup.number('Ceiling percentile', 90, { min: 60, max: 99 });
const nearPercent = rangeGroup.number('Near level within %', 5, { min: 1, max: 25 });

const showGroup = input.group('Show');
const showEarnings = showGroup.boolean('P/E levels', true);
const showSales = showGroup.boolean('P/S levels', true);
const showCash = showGroup.boolean('P/FCF levels', true);
const showBook = showGroup.boolean('P/B levels', true);
const showEbitda = showGroup.boolean('EV/EBITDA levels', true);
const labelStyleChoice = showGroup.select('Level labels', 'Compact', ['Compact', 'Full', 'Off']);
const showOverlay = showGroup.boolean('Summary panel', true);

const dataGroup = input.group('Data');
const quartersBack = dataGroup.number('History (quarters)', 24, { min: 8, max: 40 });
const filingLagDays = dataGroup.number('Filing lag (days)', 45, { min: 0, max: 120 });

/* ========================== DATA ========================== */

assert(close.length > 30, 'Valuation Floors needs at least 30 candles.');

const lastIndex = close.length - 1;

const METRICS = ['eps_diluted', 'revenue', 'free_cash_flow', 'total_equity', 'ebitda', 'shares_diluted_is', 'net_debt'];

const fundamentals = await request.fundamental(current.ticker, METRICS, quartersBack);
assert(fundamentals && !fundamentals.error, 'Fundamental data unavailable for this symbol. Works on US equities.');

const toSeconds = value => (value > 1e11 ? value / 1000 : value);
const quarters = {};

for (let index = 0; index < METRICS.length; index += 1) {
	const name = METRICS[index];
	const rows = Array.isArray(fundamentals[name]) ? fundamentals[name] : [];
	for (let row = 0; row < rows.length; row += 1) {
		const entry = rows[row];
		if (!entry || !Number.isFinite(entry.reportdate)) {
			continue;
		}
		const key = String(entry.reportDateShort || entry.reportdate);
		if (!quarters[key]) {
			quarters[key] = { periodEnd: toSeconds(entry.reportdate) };
		}
		quarters[key][name] = Number.isFinite(entry.value) ? entry.value : null;
	}
}

const reports = Object.keys(quarters).map(key => quarters[key]).sort((first, second) => first.periodEnd - second.periodEnd);
assert(reports.length >= 4, 'Not enough quarterly history for trailing twelve month figures.');

const valueOf = (report, name) => (report && Number.isFinite(report[name]) ? report[name] : null);

const trailingSum = (index, name) => {
	if (index < 3) {
		return null;
	}
	let total = 0;
	for (let back = 0; back < 4; back += 1) {
		const value = valueOf(reports[index - back], name);
		if (value === null) {
			return null;
		}
		total += value;
	}
	return total;
};

//	Per-share trailing metrics at each report. EV/EBITDA needs net debt per
//	share as well, since enterprise value is price plus net debt.
for (let index = 0; index < reports.length; index += 1) {
	const report = reports[index];
	const shares = valueOf(report, 'shares_diluted_is');
	const perShare = total => (total !== null && shares !== null && shares > 0 ? total / shares : null);

	report.knownFrom = report.periodEnd + filingLagDays * 86400;
	report.epsPs = trailingSum(index, 'eps_diluted');
	report.salesPs = perShare(trailingSum(index, 'revenue'));
	report.cashPs = perShare(trailingSum(index, 'free_cash_flow'));
	report.bookPs = perShare(valueOf(report, 'total_equity'));
	report.ebitdaPs = perShare(trailingSum(index, 'ebitda'));
	report.netDebtPs = perShare(valueOf(report, 'net_debt'));
}

/* ========================== AS-OF SERIES ========================== */

const reportAsOf = close.map(() => -1);
let pointer = 0;
for (let bar = 0; bar < close.length; bar += 1) {
	while (pointer < reports.length && reports[pointer].knownFrom <= time[bar]) {
		pointer += 1;
	}
	reportAsOf[bar] = pointer - 1;
}

const asOf = name => close.map((price, bar) => {
	const index = reportAsOf[bar];
	if (index < 0) {
		return null;
	}
	const value = reports[index][name];
	return Number.isFinite(value) ? value : null;
});

const netDebtPs = asOf('netDebtPs');

/* ========================== MULTIPLES AND LEVELS ========================== */

//	One block per multiple: the history of the multiple over the lookback,
//	its floor and ceiling percentile, and the price those imply on each bar.
const lookbackStart = time[lastIndex] - lookbackYears * 365.25 * 86400;

const percentileOf = (sample, fraction) => {
	if (sample.length === 0) {
		return null;
	}
	const position = Math.min(sample.length - 1, Math.max(0, Math.round(fraction * (sample.length - 1))));
	return sample[position];
};

const buildLevels = (metricName, enterprise, enabled) => {
	const metric = asOf(metricName);

	//	The multiple on each bar, only where the metric is positive.
	const multiple = close.map((price, bar) => {
		const base = metric[bar];
		if (!enabled || !Number.isFinite(base) || base <= 0 || !Number.isFinite(price)) {
			return null;
		}
		const numerator = enterprise ? price + (Number.isFinite(netDebtPs[bar]) ? netDebtPs[bar] : 0) : price;
		return numerator > 0 ? numerator / base : null;
	});

	const sample = [];
	for (let bar = 0; bar < close.length; bar += 1) {
		if (time[bar] >= lookbackStart && Number.isFinite(multiple[bar])) {
			sample.push(multiple[bar]);
		}
	}
	sample.sort((first, second) => first - second);

	const usable = sample.length >= 40;
	const lowMultiple = usable ? percentileOf(sample, floorPercentile / 100) : null;
	const highMultiple = usable ? percentileOf(sample, ceilingPercentile / 100) : null;

	const priceAt = (bar, target) => {
		const base = metric[bar];
		if (!enabled || target === null || !Number.isFinite(base) || base <= 0) {
			return null;
		}
		const level = target * base - (enterprise && Number.isFinite(netDebtPs[bar]) ? netDebtPs[bar] : 0);
		return level > 0 ? level : null;
	};

	return {
		multiple,
		lowMultiple,
		highMultiple,
		floor: close.map((price, bar) => priceAt(bar, lowMultiple)),
		ceiling: close.map((price, bar) => priceAt(bar, highMultiple))
	};
};

const earnings = buildLevels('epsPs', false, showEarnings);
const sales = buildLevels('salesPs', false, showSales);
const cash = buildLevels('cashPs', false, showCash);
const book = buildLevels('bookPs', false, showBook);
const ebitda = buildLevels('ebitdaPs', true, showEbitda);

const all = [earnings, sales, cash, book, ebitda];

//	Composite: the median of whichever levels exist on the bar.
const medianOf = values => {
	const sorted = values.filter(Number.isFinite).sort((first, second) => first - second);
	if (sorted.length === 0) {
		return null;
	}
	const middle = Math.floor(sorted.length / 2);
	return sorted.length % 2 === 1 ? sorted[middle] : (sorted[middle - 1] + sorted[middle]) / 2;
};

const compositeFloor = close.map((price, bar) => medianOf(all.map(block => block.floor[bar])));
const compositeCeiling = close.map((price, bar) => medianOf(all.map(block => block.ceiling[bar])));

/* ========================== DRAW ========================== */

const FLOOR_COLOR = '#3F8FD2';
const CEILING_COLOR = '#C8453A';
const COMPOSITE_FLOOR = '#1F5F9A';
const COMPOSITE_CEILING = '#8A2A22';

//	Floors are solid steps, ceilings are dotted, so the two read apart by
//	texture as well as by colour and by the arrow in the label.
const thin = (name, color) => ({ name, color, style: 'ladder', thickness: 1, ignoreWhenScaling: true, hideInLegend: true });
const dotted = (name, color) => ({ name, color, style: 'dotted', marker: 'circle', thickness: 1, ignoreWhenScaling: true, hideInLegend: true });

const floorRefs = [
	paint(earnings.floor, thin('P/E floor', FLOOR_COLOR)),
	paint(sales.floor, thin('P/S floor', FLOOR_COLOR)),
	paint(cash.floor, thin('P/FCF floor', FLOOR_COLOR)),
	paint(book.floor, thin('P/B floor', FLOOR_COLOR)),
	paint(ebitda.floor, thin('EV/EBITDA floor', FLOOR_COLOR))
];

const ceilingRefs = [
	paint(earnings.ceiling, dotted('P/E ceiling', CEILING_COLOR)),
	paint(sales.ceiling, dotted('P/S ceiling', CEILING_COLOR)),
	paint(cash.ceiling, dotted('P/FCF ceiling', CEILING_COLOR)),
	paint(book.ceiling, dotted('P/B ceiling', CEILING_COLOR)),
	paint(ebitda.ceiling, dotted('EV/EBITDA ceiling', CEILING_COLOR))
];

const compositeFloorRef = paint(compositeFloor, { name: 'Composite floor', color: COMPOSITE_FLOOR, style: 'ladder', thickness: 2, ignoreWhenScaling: true });
const compositeCeilingRef = paint(compositeCeiling, { name: 'Composite ceiling', color: COMPOSITE_CEILING, style: 'ladder', thickness: 2, ignoreWhenScaling: true });
fill(compositeFloorRef, compositeCeilingRef, '#8A8F98', 0.06, 'Valuation band');

//	Labels at the last bar. Always ten calls, a space where a level is absent
//	or labels are off. No callout box: coloured text with a thin halo is far
//	lighter on the chart, and the colour already says floor or ceiling, so
//	the compact form is just the metric name.
const LABELS = ['P/E', 'P/S', 'P/FCF', 'P/B', 'EV/EBITDA'];
const SHORT = ['PE', 'PS', 'FCF', 'PB', 'EV'];

const labelText = (index, isFloor) => {
	const level = isFloor ? all[index].floor[lastIndex] : all[index].ceiling[lastIndex];
	if (labelStyleChoice === 'Off' || !Number.isFinite(level)) {
		return ' ';
	}
	const arrow = isFloor ? '▲' : '▼';
	return labelStyleChoice === 'Full' ? `${arrow} ${LABELS[index]} ${isFloor ? 'floor' : 'ceiling'}` : `${arrow}${SHORT[index]}`;
};

const floorLabel = { color: FLOOR_COLOR, border_width: 0, border_radius: 0, halo: true, vertical_align: 'middle' };
const ceilingLabel = { color: CEILING_COLOR, border_width: 0, border_radius: 0, halo: true, vertical_align: 'middle' };

for (let index = 0; index < 5; index += 1) {
	paint_label_at_line(floorRefs[index], lastIndex, labelText(index, true), floorLabel);
	paint_label_at_line(ceilingRefs[index], lastIndex, labelText(index, false), ceilingLabel);
}

//	The composite lines carry a word, since they are the two that matter most.
const compositeText = (isFloor, level) => (labelStyleChoice === 'Off' || !Number.isFinite(level) ? ' ' : (isFloor ? '▲ floor' : '▼ ceiling'));
paint_label_at_line(compositeFloorRef, lastIndex, compositeText(true, compositeFloor[lastIndex]), Object.assign({}, floorLabel, { color: COMPOSITE_FLOOR }));
paint_label_at_line(compositeCeilingRef, lastIndex, compositeText(false, compositeCeiling[lastIndex]), Object.assign({}, ceilingLabel, { color: COMPOSITE_CEILING }));

/* ========================== SUMMARY PANEL ========================== */

const lastPrice = close[lastIndex];
const fmt = value => (Number.isFinite(value) ? value.toFixed(1) : 'n/a');
const money = value => (Number.isFinite(value) ? value.toFixed(2) : 'n/a');
const rows = [];

if (showOverlay) {
	const parts = [];
	for (let index = 0; index < 5; index += 1) {
		const block = all[index];
		if (Number.isFinite(block.multiple[lastIndex])) {
			parts.push(`${LABELS[index]} ${fmt(block.multiple[lastIndex])} (${fmt(block.lowMultiple)}–${fmt(block.highMultiple)})`);
		}
	}
	rows.push({ cells: [{ text: parts.length > 0 ? parts.join('  ·  ') : 'No positive metrics to build multiples from' }] });

	if (Number.isFinite(compositeFloor[lastIndex]) && Number.isFinite(compositeCeiling[lastIndex])) {
		const toFloor = compositeFloor[lastIndex] / lastPrice - 1;
		const toCeiling = compositeCeiling[lastIndex] / lastPrice - 1;
		rows.push({ cells: [{ text: `Composite floor ${money(compositeFloor[lastIndex])} (${(toFloor * 100).toFixed(0)}%)  ·  ceiling ${money(compositeCeiling[lastIndex])} (+${(toCeiling * 100).toFixed(0)}%)  ·  ${lookbackYears}y range, p${floorPercentile}–p${ceilingPercentile}` }] });
	}
}

paint_overlay('Summary', { position: 'top_left', parent: 'chart', offset_x: 8, offset_y: 40 }, { rows });

/* ========================== SIGNALS ========================== */

const near = (level, price) => Number.isFinite(level) && Math.abs(price / level - 1) <= nearPercent / 100;

register_signal(close.map((price, bar) => all.some(block => near(block.floor[bar], price))), 'Near a floor');
register_signal(close.map((price, bar) => all.some(block => near(block.ceiling[bar], price))), 'Near a ceiling');
register_signal(close.map((price, bar) => Number.isFinite(compositeFloor[bar]) && price < compositeFloor[bar]), 'Below composite floor');
register_signal(close.map((price, bar) => Number.isFinite(compositeCeiling[bar]) && price > compositeCeiling[bar]), 'Above composite ceiling');
register_signal(close.map((price, bar) => bar > 0 && Number.isFinite(compositeFloor[bar]) && price > compositeFloor[bar] && Number.isFinite(compositeFloor[bar - 1]) && close[bar - 1] <= compositeFloor[bar - 1]), 'Reclaimed composite floor');
register_signal(close.map((price, bar) => all.filter(block => Number.isFinite(block.floor[bar]) && price < block.floor[bar]).length >= 2), 'Below two or more floors');Traders also viewed