Disclaimer
All information shown on this page is for illustrative purposes only and should not be construed as investment, financial, market or other advice. Any information shown on this page that purports to be based upon past or current market conditions may not be complete, timely or accurate and, in any event, is not predictive of future outcomes.
Report This Indicator
(Griffin Likelihood Engine LITE)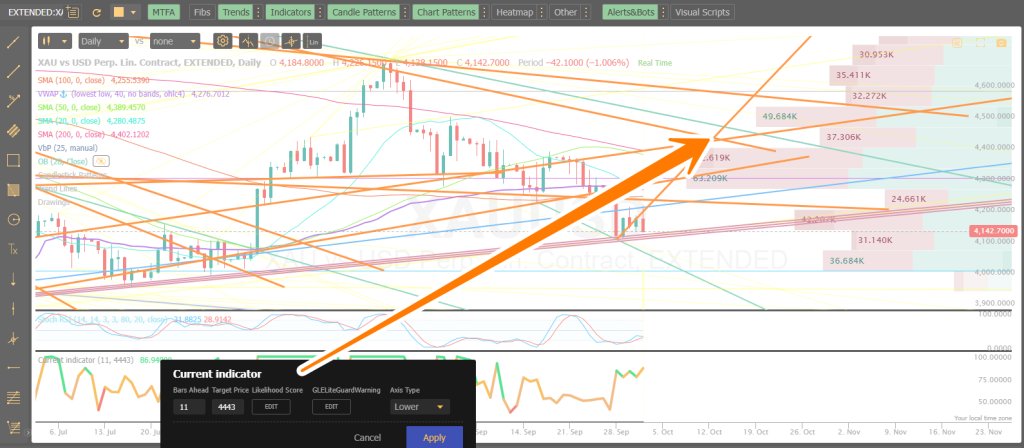
Griffin Likelihood Engine – GLE‑Lite with Behaviour Matrix (with ↑ / ↓ Entry–Exit Logic)
XAUUSD Daily — Lite Edition – #TSBuild26
Simply entering two data fields into the indicator, you will receive a "LIKELIHOOD SCORE" of that future event happening.
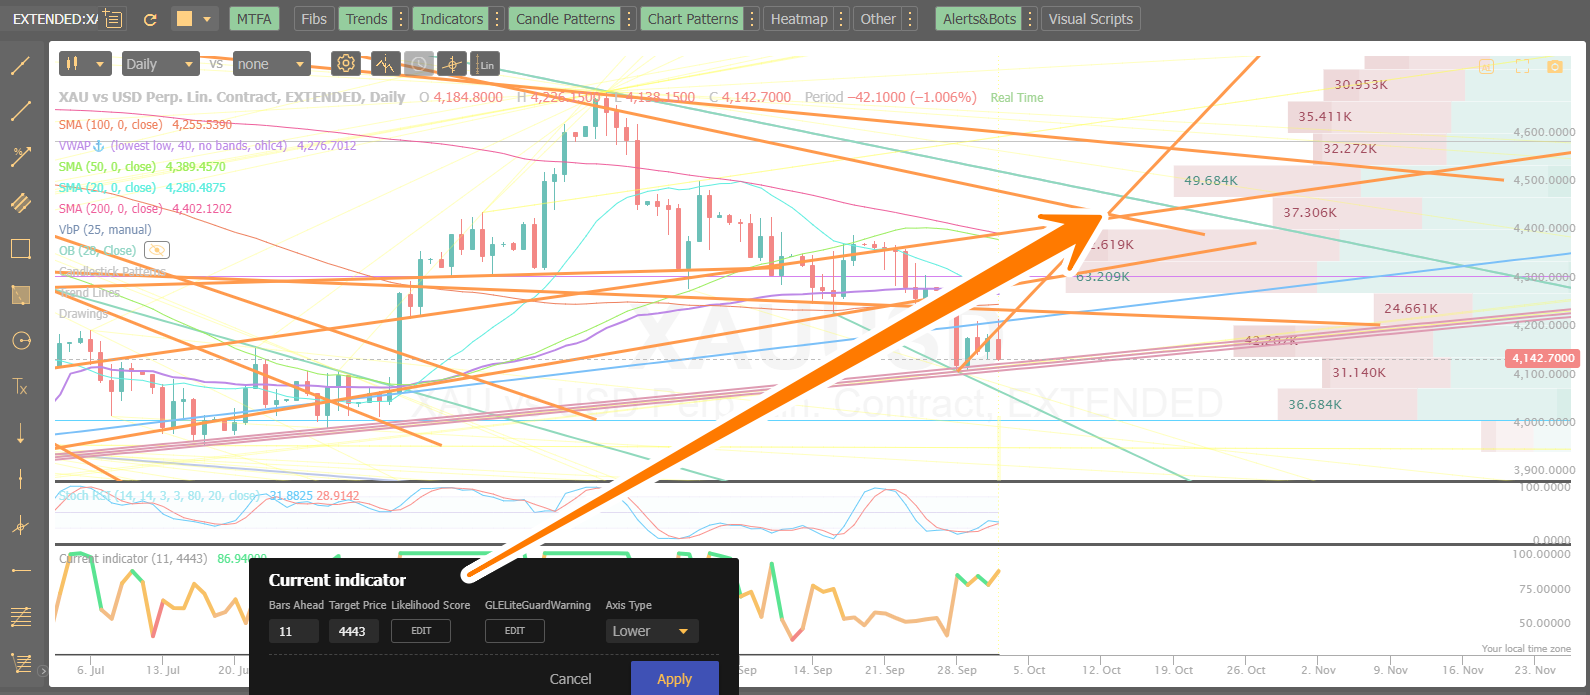
Enter the amount of "bars/candles" in the future – and the price where the intersections meet.
See the screenshot to see how using TrendSpider trend lines, and your own lines can create "future intersections"
The Engine evaluates everything in the TrendSpider system, such as Trend Integrity, Liquidity Gravity, Order-Flow Pressure, Volatility Regime, Structural Alignment, to evaluate your intersection and give you a score, which changes in real time.
Guidance is given below of Entry & Exit points to provide conviction in your trade.
- 🟩 GREEN — Bullish Continuation Bias
Meaning:
Trend structure, momentum, and volatility regime are aligned in a bullish continuation posture.
Behaviour Summary
Hold longs
Add on pullbacks
Avoid shorts
Watch for slope weakening (early transition)
🟧 ORANGE — Transitional / Mixed Bias
Meaning:
Momentum and structure are diverging; market is shifting.
Entry Conditions (Lite Edition)
No new directional entries
Orange is a wait zone, not a trade zone.
Exit Conditions
↓ Exit Long if Green → Orange
Trend weakening.
↑ Exit Short if Red → Orange
Bearish pressure fading.
Behaviour Summary
Reduce size
Avoid new trades
Wait for resolution (Green or Red)
Treat arrows as caution signals, not entries
🟥 RED — Bearish Continuation Bias
Meaning:
Trend structure, momentum, and volatility regime are aligned in a bearish continuation posture.
Directional Arrows
↓ Down Arrow (Continuation)
Sellers are in control; trend pressure is downward.
↑ Up Arrow (Corrective Rally)
Rallies are typically temporary and often create re‑entry opportunities.
Entry Conditions (Lite Edition)
↓ Enter Short on Down Arrow
When the score is falling and the colour stays Red.
↑ Enter Short on Up Arrow (only if Red remains)
When price rallies but the bias stays Red — classic bearish continuation setup.
Exit Conditions
↑ Exit Short if Red → Orange
Momentum weakening; trend integrity deteriorating.
↑↑ Exit Short if Red → Green
Full bullish transition; continuation no longer valid.
Behaviour Summary
Hold shorts
Add on rallies
Avoid longs
Watch for slope strengthening (early transition)
| 🟩 Green | Bullish continuation | Corrective pullback / early strength | Trend continuation | Long ↑ or ↓ (if Green holds) | Exit long on Green→Orange or Green→Red |
|---|---|---|---|---|---|
| 🟧 Orange | Transitional | Early reversal pressure | Weak continuation | No entries | Exit longs on Green→Orange; exit shorts on Red→Orange |
| 🟥 Red | Bearish continuation | Corrective rally / early strength | Trend continuation | Short ↓ or ↑ (if Red holds) | Exit short on Red→Orange or Red→Green |
GET STARTED :
1 – Draw additional trend lines as per the orange lines on the chart.
2 – Find and note future intersections, where the lines cross – (the more lines that cross in one point "lends more weight for the engine")
3 – Note the live price and timeframe (time = Bars/candles in the future)
4 – GLE shows a "Likelihood Score on the indicator, 0-100, in colour GREEN ORANGE RED, (Green 99% is highly likely – Red 1.0% is very unlikely) in real time it will change with price, giving you trend likelihood based on the factors above. NFA
// === Indicator Name ===
describe_indicator("Griffin Likelihood Engine LITE", "lower");

// === User Inputs ===
const barIntersection = input.number("Bars Ahead", 23, { min: 1, max: 100 });
const targetPrice    = input.number("Target Price", 50000, { min: 0, max: 1000000 });

// ------------------------------------------------------------
//   GLE-Lite (XAUUSD Daily Edition)
//   This Lite version only works on:
//   • Symbol: EXTENDED:XAUUSD
//   • Timeframe: 1 Day
//
//   Upgrade to GLE v5.2 PRO for:
//   • All symbols (indices, FX, crypto, metals, equities)
//   • All timeframes (1m → 1W)
//   • Probability momentum engine
//   • Liquidity gravity modelling
//   • Volatility regime analysis
//   • Trend-integrity scoring
//   • Full bias-slope-score matrix
//   • Conviction engine
//   • Reversal pressure detection
//   • Continuation strength modelling
// ------------------------------------------------------------

// === Guard: this LITE version only runs on EXTENDED:XAUUSD, Daily timeframe ===
const myIsSymbolValid = current.symbol === "EXTENDED:XAUUSD" || current.ticker === "EXTENDED:XAUUSD";
const myIsTimeframeValid = current.resolution === "D";
const myIsGuardValid = myIsSymbolValid && myIsTimeframeValid;

// === Target Series ===
const targetSeries = horizontal_line(targetPrice);

// === INVALID INPUT CHECK (±300% from current price) ===
const invalidScore = for_every(close, targetSeries, (c, t) => {
  const diff = Math.abs(t - c) / c;
  return diff > 3.00 ? 1 : 0;
});

// === Base Price Indicators ===
const rocSeries = roc(close, barIntersection);
const momSeries = momentum(close, barIntersection);
const volSeries = cmo(close, barIntersection);

// === Volatility Regime ===
const atrSeries = atr(14);
const atrSlow   = sma(atrSeries, 50);
const atrRatio  = div(atrSeries, atrSlow);

const bbMid   = sma(close, 20);
const bbStd   = stdev(close, 20);
const bbUpper = add(bbMid, mult(bbStd, horizontal_line(2)));
const bbLower = sub(bbMid, mult(bbStd, horizontal_line(2)));
const bbWidth = div(sub(bbUpper, bbLower), bbMid);

const volRegimeScore = for_every(atrRatio, bbWidth, (ar, bw) => {
  if (ar < 0.8 && bw < 0.02) return 0.5;
  if (ar < 1.2 && bw < 0.04) return 1.0;
  return 1.6;
});

// === Trend Structure ===
const emaFast = ema(close, 8);
const emaMid  = ema(close, 21);
const emaSlow = ema(close, 50);

const emaStackScore = for_every(emaFast, emaMid, emaSlow, (f, m, s) => {
  if (f > m && m > s) return 1.5;
  if (f < m && m < s) return 0.6;
  return 1.0;
});

const trendSlope = sub(emaFast, emaSlow);
const trendSlopeScore = for_every(trendSlope, (slope) => {
  if (slope > 0) return 1.3;
  if (slope < 0) return 0.7;
  return 1.0;
});

const prevHigh = shift(high, 1);
const prevLow  = shift(low, 1);
const hhHlScore = for_every(high, low, prevHigh, prevLow, (h, l, ph, pl) => {
  const hh = h > ph;
  const hl = l > pl;
  const lh = h < ph;
  const ll = l < pl;
  if (hh && hl) return 1.4;
  if (ll && lh) return 0.6;
  return 1.0;
});

const trendStructScore = mult(mult(emaStackScore, trendSlopeScore), hhHlScore);

// === Liquidity & Order Flow ===
const volAvg = sma(volume, 20);
const relVol = div(volume, volAvg);

const barRange   = sub(high, low);
const rangeAvg   = sma(barRange, 20);
const rangeRatio = div(barRange, rangeAvg);

const liquidityCompressionScore = for_every(rangeRatio, relVol, (rr, rv) => {
  if (rr < 0.7 && rv > 1.3) return 1.6;
  if (rr > 1.3 && rv < 0.8) return 0.6;
  return 1.0;
});

const volDelta = for_every(close, open, volume, (c, o, v) => {
  return c > o ? v : (c < o ? -v : 0);
});

const ofEma   = ema(volDelta, 10);
const ofScore = for_every(ofEma, (d) => {
  if (d > 0) return 1.5;
  if (d < 0) return 0.6;
  return 1.0;
});

// === Liquidity Gravity vs Target ===
const distSeries   = sub(targetSeries, close);
const absDist      = for_every(distSeries, (d) => Math.abs(d));
const distFactor   = div(absDist, close);

const liquidityGravityScore = for_every(distFactor, relVol, (df, rv) => {
  if (df < 0.01 && rv > 1.2) return 0.5;
  if (df > 0.03 && rv < 0.8) return 1.5;
  return 1.0;
});

// === Target Price Difficulty (original aggressive) ===
const timeFactor = horizontal_line(barIntersection / 100);
const difficultyLinear = for_every(distFactor, timeFactor, (df, tf) => {
  return df * 0.5 + tf * 0.5;
});
const difficultySquared = for_every(difficultyLinear, (d) => d * d);

// === Volatility Adjustment ===
const volAdj = for_every(atrSeries, close, (atrVal, c) => {
  if (atrVal <= 0 || c <= 0) return 1.0;
  const ratio = atrVal / c;
  if (ratio < 0.01) return 0.9;
  if (ratio > 0.05) return 1.1;
  return 1.0;
});

// === Interaction Terms ===
const i1 = mult(rocSeries, momSeries);
const i2 = mult(rocSeries, volSeries);
const i3 = mult(momSeries, volSeries);
const temp = mult(momSeries, volSeries);
const i4   = mult(rocSeries, temp);

const volLiquTrendScore = mult(
  mult(volRegimeScore, liquidityCompressionScore),
  trendStructScore
);

const ofTrendScore = mult(ofScore, trendSlopeScore);

// === VWAP Directional Bias ===
const vwapSeries = vwap();
const vwapDist = sub(close, vwapSeries);
const vwapBias = for_every(vwapDist, (d) => {
  if (d > 0) return 1.35;
  if (d < 0) return 0.65;
  return 1.0;
});

// === Historical Intersection Confidence (HIC) ===
const pastHigh = shift(high, barIntersection);
const pastLow  = shift(low, barIntersection);
const pastHit = for_every(pastHigh, pastLow, targetSeries, (ph, pl, t) => {
  return (t <= ph && t >= pl) ? 1 : 0;
});
const histConfidence = for_every(pastHit, (h) => {
  return h === 1 ? 1.35 : 1.0;
});

// === Directional Bias Engine (aggressive + VWAP + HIC) ===
const dirTrendBias = for_every(trendSlope, (s) => {
  if (s > 0) return 1.45;
  if (s < 0) return 0.55;
  return 1.0;
});

const dirFlowBias = for_every(ofEma, (d) => {
  if (d > 0) return 1.35;
  if (d < 0) return 0.65;
  return 1.0;
});

const dirVolBias = for_every(atrRatio, (ar) => {
  if (ar > 1.2) return 1.30;
  if (ar < 0.8) return 0.70;
  return 1.0;
});

const dirTargetBias = for_every(targetSeries, close, (t, c) => {
  if (t > c) return 1.40;
  if (t < c) return 0.60;
  return 1.0;
});

// === Combine All Biases ===
const directionalBias = mult(
  mult(dirTrendBias, dirFlowBias),
  mult(mult(dirVolBias, dirTargetBias), mult(vwapBias, histConfidence))
);

// === Raw Score (original aggressive model) ===
const rawScore = for_every(
  rocSeries,
  momSeries,
  volSeries,
  i1,
  i2,
  i3,
  i4,
  difficultySquared,
  trendStructScore,
  volRegimeScore,
  liquidityGravityScore,
  volLiquTrendScore,
  ofTrendScore,
  volAdj,
  directionalBias,
  (r, m, v, a, b, c, d, diff, ts, vr, lg, vlt, oft, va, db) => {
    const priceBlock =
      r  * 0.08 +
      m  * 0.08 +
      v  * 0.06 +
      a  * 0.05 +
      b  * 0.05 +
      c  * 0.03 +
      d  * 0.03;

    const regimeBlock =
      ts  * 0.30 +
      vr  * 0.25 +
      lg  * -0.18 +
      vlt * 0.30 +
      oft * 0.25;

    const adjusted = (priceBlock + regimeBlock) * va * db - diff * 0.10;
    if (adjusted > 200) return 200;
    if (adjusted < -200) return -200;
    return adjusted;
  }
);

// === Sigmoid Probability Scaling (original steep) ===
const sigmoidScore = for_every(rawScore, (x) => {
  const s = 1 / (1 + Math.exp(-x / 4.5));
  return Math.max(0, Math.min(s * 100, 100));
});

// === Color Zones ===
const scoreColorComputed = for_every(sigmoidScore, (v) => {
  if (v >= 80) return "#12d962";
  if (v >= 60) return "#f5a623";
  if (v >= 40) return "#eea151";
  return "#ee5451";
});

// === FINAL SCORE (numeric only, safe for painting) ===
const finalScoreComputed = for_every(sigmoidScore, invalidScore, (s, inv) => {
  if (inv === 1) return NaN;
  return Math.round(s * 100) / 100;
});

// === Apply guard: if symbol/timeframe is wrong, blank out the output instead of running the engine's result ===
const finalScore = myIsGuardValid ? finalScoreComputed : series_of(null);
const scoreColor = myIsGuardValid ? scoreColorComputed : series_of("#ee5451");

// === Paint Likelihood Score ===
paint(finalScore, {
  name: "Likelihood Score",
  color: scoreColor,
  thickness: 4
});

// === Warning overlay when the guard is not satisfied ===
paint_overlay("GLELiteGuardWarning", { position: "top_right" }, {
  rows: myIsGuardValid ? [] : [{
    cells: [{
      text: "LITE version is only for GOLD (EXTENDED:XAUUSD) - Daily chart - Please Buy Griffin Likelihood Engine v5.2 - for all instruments and timeframes.",
      color: "#ee5451"
    }]
  }]
});Traders also viewed