Disclaimer
All information shown on this page is for illustrative purposes only and should not be construed as investment, financial, market or other advice. Any information shown on this page that purports to be based upon past or current market conditions may not be complete, timely or accurate and, in any event, is not predictive of future outcomes.
Report This Indicator
(Fair Value Gap Finder)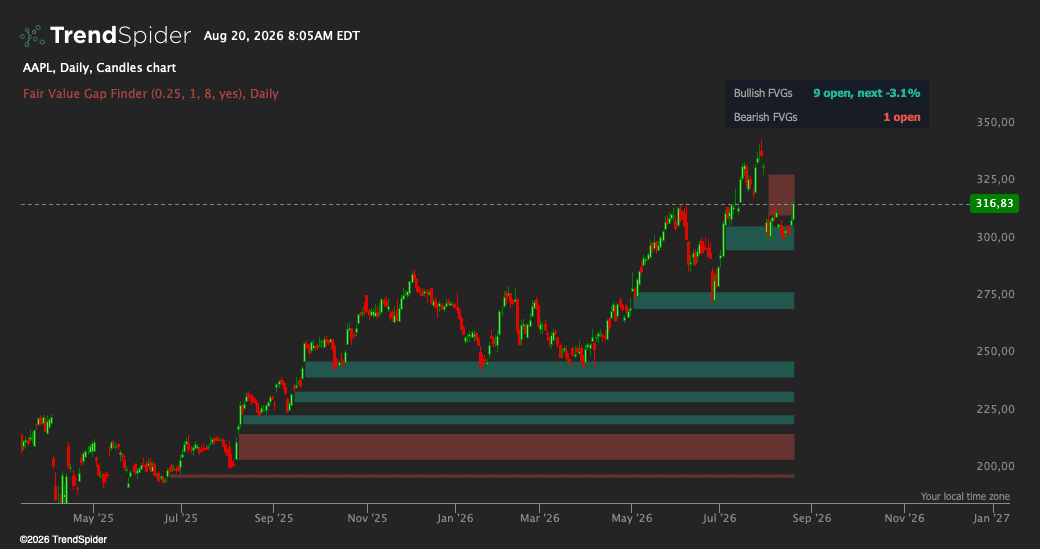
This indicator detects fair value gaps the moment they complete and manages their entire life on the chart for you. A fair value gap is a three candle imbalance: a displacement candle so strong that it leaves a price range between the first candle's high and the third candle's low (or the mirror) where nothing ever traded. Price has a well documented tendency to revisit these ranges, which makes unfilled gaps some of the most watched areas on any chart. The pattern completes on the close of the third candle, so detection is instant: no smoothing, no confirmation delay, no lag, and nothing ever repaints.
Teal boxes are bullish gaps, imbalances left below by strong upward moves, watched as support on the return visit. Red boxes are bearish gaps above. Every gap stays on the chart until price trades through it completely, at which point it is retired. A compact dashboard shows how many gaps remain open on each side and the distance to the nearest one above and below, so the imbalance structure of the chart is readable in one glance.
Two filters separate meaningful gaps from noise, and both are normalized by ATR so they behave identically on a quiet large cap and a volatile crypto pair. Min Gap Size discards gaps too small to matter. Min Displacement requires the middle candle to be a genuine impulse, not drift. With the defaults, a typical daily chart produces roughly one qualifying gap per direction per month: enough to work with, rare enough to mean something.
The Signals
You'll see several conditions, all available in the Market Scanner, in alerts, and in the Strategy Tester:
A) New Bullish FVG and New Bearish FVG fire on the exact bar a qualifying gap forms.
B) Bullish FVG Tapped and Bearish FVG Tapped fire once, the first time price returns into a gap. This is the event most gap traders actually trade, and it fires exactly once per gap, not on every bar inside it.
C) Bullish FVG Filled and Bearish FVG Filled fire when price trades through the entire gap. The gap is then retired from the chart: filled gaps do not linger as clutter.
D) Price Inside Bullish FVG and Price Inside Bearish FVG are state flags for filtering watchlists and scans.
How To Use It
The core setup is the return visit. After a strong move leaves a bullish gap behind, the trade thesis on the tap is that the imbalance acts as support: entry when price returns into the gap, stop below the gap's bottom edge (if the gap fills completely, the thesis is simply wrong), first target back toward the origin of the move. The dashboard shows the distance to the nearest gap on each side before you commit. New gap signals also serve as momentum evidence on their own: a session that leaves a qualifying gap was, by construction, a displacement session.
The scanner turns this into a daily workflow. Run Bullish FVG Tapped across your universe in the evening and you get every symbol that just returned to an unfilled imbalance: a short, concrete list worth reviewing. Set alerts on symbols approaching a large open gap and you'll know the moment the retest begins.
This indicator completes a set with my other tools. Auto Supply & Demand Zones maps where volume backed buyers and sellers acted; Liquidity Sweep Detector shows when resting stops get taken; this one shows where price moved too fast to trade. A gap tap that lands inside a demand zone, or right after a bullish sweep, stacks independent reasons for the same trade at the same price, and running these scans together is the strongest workflow in my catalog.
The indicator marks locations and events; it does not predict outcomes. Gaps fill against the trade regularly. The value of the tool is that the gap's far edge makes the invalidation point explicit before entry, so risk can be defined in advance.
Traders also viewed