Disclaimer
All information shown on this page is for illustrative purposes only and should not be construed as investment, financial, market or other advice. Any information shown on this page that purports to be based upon past or current market conditions may not be complete, timely or accurate and, in any event, is not predictive of future outcomes.
Report This Indicator
(World Bank Indicators – Public Sector)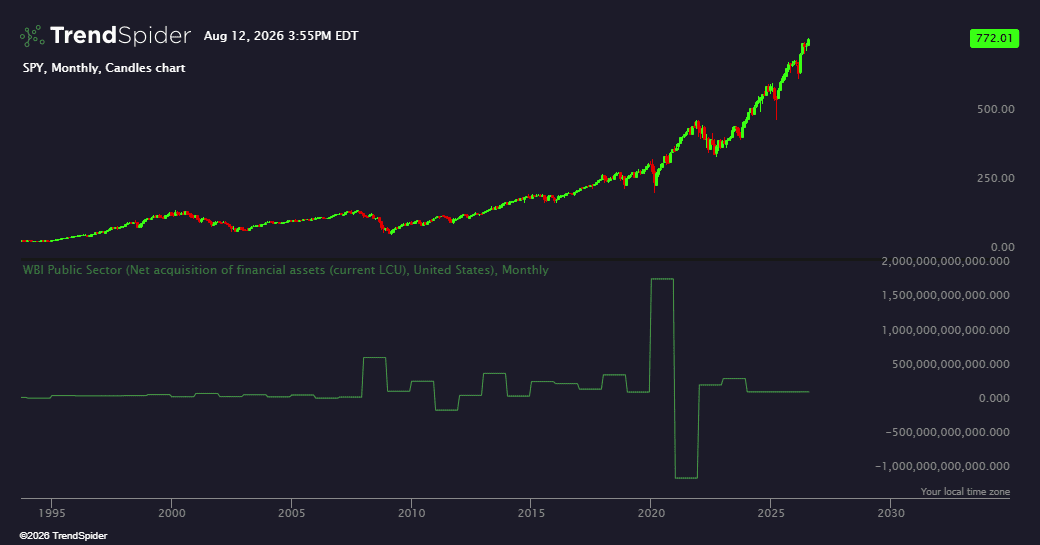
General Idea
This indicator fetches and displays public sector data from the World Bank API. It allows you to visualize various government financial metrics (like tax revenue, debt, or military spending) for different countries overlaid on your chart. The indicator retrieves annual economic data and displays it as a horizontal step line that updates once per year.
How It Works
The indicator connects to the World Bank's public sector database and lets you choose from dozens of metrics across multiple countries. Since World Bank data is published annually (not daily or intraday like price data), the indicator takes each year's data point and extends it horizontally across all candles within that year, creating a step-like pattern. This means you'll see the indicator value remain constant throughout each calendar year, then step up or down when new annual data becomes available.
Usage
Select your desired country (from major economies like the US, China, EU, etc.) and choose an indicator from the dropdown menu. The indicator will display metrics like government debt as % of GDP, tax revenues, military expenditures, or human capital indices. This is particularly useful for fundamental analysis when you want to understand how macroeconomic fiscal conditions correlate with market movements. For example, you might overlay government debt levels while analyzing treasury bonds or currency pairs.
Important Notes
Because World Bank data updates only annually and often with a lag, this indicator is best suited for long-term analysis on weekly, monthly, or yearly charts. The data will appear as flat horizontal lines that change only once per year. If the most recent World Bank data is older than your chart's starting point, the indicator automatically extends the last known value to make it visible on your current timeframe.
const countries = {
  "Australia": "AUS",
  "Canada": "CAN",
  "China": "CHN",
  "European Union": "EUU",
  "Japan": "JPN",
  "Mexico": "MEX",
  "United Kingdom": "GBR",
  "United States": "USA",
  "World": "WLD"
};
const validIndicatorIds = ["GC.AST.TOTL.GD.ZS","GC.AST.TOTL.CN","GC.DOD.TOTL.CN","GC.DOD.TOTL.GD.ZS","GC.LBL.TOTL.CN","GC.NFN.TOTL.CN","GC.LBL.TOTL.GD.ZS","GC.NFN.TOTL.GD.ZS","GC.NLD.TOTL.CN","GC.NLD.TOTL.GD.ZS","GC.REV.GOTR.CN","GC.REV.SOCL.ZS","GC.REV.XGRT.CN","GC.REV.SOCL.CN","GC.REV.GOTR.ZS","GC.REV.XGRT.GD.ZS","GC.TAX.GSRV.CN","GC.TAX.GSRV.RV.ZS","GC.TAX.IMPT.CN","GC.TAX.IMPT.ZS","GC.TAX.GSRV.VA.ZS","GC.TAX.INTT.CN","GC.TAX.OTHR.CN","GC.TAX.OTHR.RV.ZS","GC.TAX.TOTL.CN","GC.TAX.INTT.RV.ZS","GC.TAX.TOTL.GD.ZS","GC.TAX.YPKG.CN","GC.TAX.YPKG.RV.ZS","GC.TAX.YPKG.ZS","GC.XPN.COMP.ZS","GC.XPN.GSRV.CN","GC.XPN.GSRV.ZS","GC.XPN.COMP.CN","GC.XPN.INTP.CN","GC.XPN.INTP.ZS","GC.XPN.OTHR.CN","GC.XPN.INTP.RV.ZS","GC.XPN.OTHR.ZS","GC.XPN.TOTL.CN","GC.XPN.TOTL.GD.ZS","GC.XPN.TRFT.ZS","GC.XPN.TRFT.CN","HD.HCI.OVRL.FE","HD.HCI.OVRL","HD.HCI.OVRL.LB","HD.HCI.OVRL.LB.MA","HD.HCI.OVRL.MA","HD.HCI.OVRL.LB.FE","HD.HCI.OVRL.UB.FE","HD.HCI.OVRL.UB.MA","HD.HCI.OVRL.UB","IQ.SPI.OVRL","IQ.SPI.PIL1","IQ.SPI.PIL5","IQ.SPI.PIL3","IQ.SPI.PIL4","MS.MIL.MPRT.KD","MS.MIL.TOTL.TF.ZS","MS.MIL.XPND.CD","MS.MIL.XPND.CN","MS.MIL.TOTL.P1","MS.MIL.XPND.GD.ZS","MS.MIL.XPND.ZS","IQ.SPI.PIL2","MS.MIL.XPRT.KD","SG.GEN.PARL.ZS","VC.BTL.DETH","VC.IDP.NWDS","VC.IHR.PSRC.FE.P5","VC.IHR.PSRC.P5","VC.IHR.PSRC.MA.P5"];
const data = await request.http(`https://api.worldbank.org/v2/topic/13/indicator?per_page=1000&format=json`);
const currentTopicIndicators = data[1].filter(indicator => validIndicatorIds.includes(indicator.id));
const indicatorTitles = currentTopicIndicators.map(indicator => indicator.name);
const currentIndicatorTitle = input.select('Indicator', indicatorTitles[0], indicatorTitles);
const currentIndicator = currentTopicIndicators.find(indicator => indicator.name == currentIndicatorTitle);
const indicatorId = currentIndicator.id;
const indicatorNote = (str => str.length > 80 ? str.slice(0, 80 - 3) + '...' : str)(currentIndicator.sourceNote);
describe_indicator(`World Bank Indicators - Public Sector`, 'lower', { citation: indicatorNote, shortName: `WBI Public Sector` });
const country = input.select('Country', 'United States', Object.keys(countries));
const indicatorData = await request.http(`https://api.worldbank.org/v2/country/${countries[country]}/indicator/${indicatorId}?format=json&per_page=20000`);
assert(indicatorData[1] && indicatorData[1].some(d => d.value !== null && d.value !== ''), `The selected indicator doesn't return any data for "${country}".`);
const indicatorTimestamps = indicatorData[1].map(record => {
  const year = parseInt(record.date);
  const milliseconds = Date.UTC(year, 0, 1);
  return milliseconds / 1000;
}).reverse();
const indicatorValues = indicatorData[1].map(record => +record.value || null).reverse();
const lastIndexWithValue = indicatorValues.reduce((a, v, i) => a = v !== null ? i : a, 0);
const isLastValueOlderThanCandles = indicatorTimestamps[lastIndexWithValue] < time[0];
if (isLastValueOlderThanCandles) {
  indicatorTimestamps.push(time[0]);
  indicatorValues.push(indicatorValues[lastIndexWithValue]);
}
const indicatorLine = interpolate_sparse_series(land_points_onto_series(indicatorTimestamps, interpolate_sparse_series(indicatorValues), time, 'ge'), 'constant');
paint(indicatorLine, 'Line', '#469e48');Traders also viewed