Disclaimer
All information shown on this page is for illustrative purposes only and should not be construed as investment, financial, market or other advice. Any information shown on this page that purports to be based upon past or current market conditions may not be complete, timely or accurate and, in any event, is not predictive of future outcomes.
Report This Indicator
(Prior Day High/Low Fib Levels v2.6)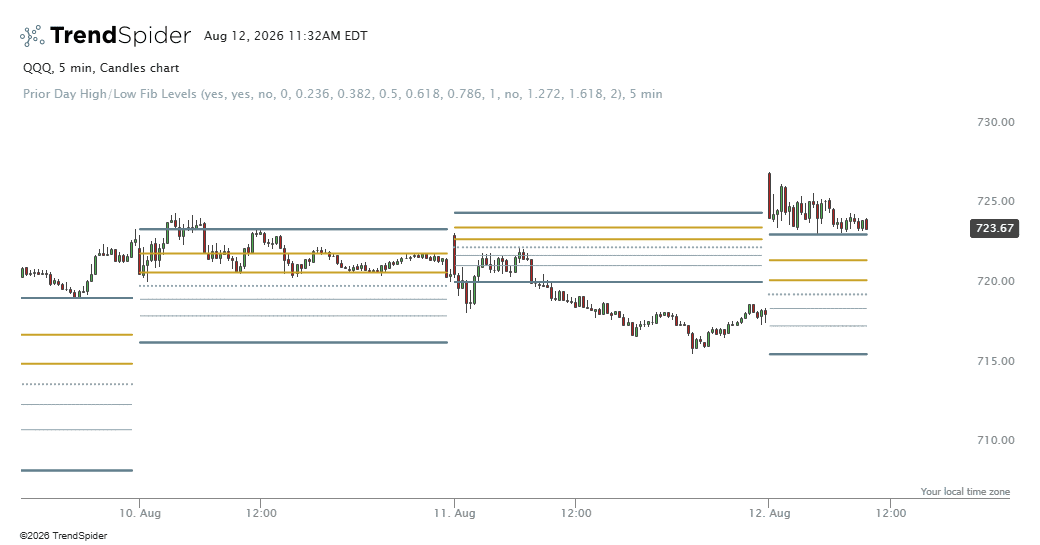
General Idea
This indicator plots Fibonacci retracement levels based on the previous day's high and low prices on intraday charts. It shows you where price might find support or resistance within today's trading session, using the prior day's range as a reference. Think of it as automatically drawing Fibonacci levels that reset each day, helping you identify potential reversal zones without manual measurement.
How It Works
The indicator fetches daily price data and identifies yesterday's high and low. It then calculates Fibonacci ratios (like 23.6%, 38.2%, 50%, 61.8%, etc.) between these two points and plots them as horizontal lines throughout today's session. You can choose whether to measure these levels upward from yesterday's low or downward from yesterday's high.
Key Features
Fibonacci Retracement Levels: Seven customizable Fibonacci levels let you adjust which ratios matter most for your trading style. The classic "golden ratios" (61.8%, 78.6%, and the extension at 161.8%) are highlighted in gold color and drawn slightly thicker to stand out.
Extension Levels: When enabled, the indicator also projects Fibonacci extensions beyond the prior day's range—both above the high and below the low. These help identify potential breakout targets when price moves beyond yesterday's boundaries.
Session Breaking: The "Break Lines at Session End" option creates visual separation between trading days by inserting gaps in the lines at each session close, making the chart cleaner and preventing lines from different days from bleeding together.
Visual Design
The color scheme uses a neutral slate gray palette for most levels, with special golden accent color for the mathematically significant golden ratio levels (61.8%, 78.6%, 161.8%). The 50% level is shown as a dotted line to make the midpoint instantly recognizable. Prior day high and low lines appear in the anchor color with increased thickness for easy reference.
Usage
This indicator works exclusively on intraday timeframes (anything below daily). It's particularly useful for day traders who want to identify key price levels where reversals or consolidations might occur during the current session. The prior day's range serves as a natural measuring stick for today's potential price movement.
describe_indicator('Prior Day High/Low Fib Levels v2.5');

// Ensure the indicator is not applied to higher timeframes
assert(
    !['D', 'W', 'M', 'Q', 'Y'].includes(constants.resolution),
    `not applicable to "${constants.resolution}" charts`
);

// ---------------------------------------------------------------
// Inputs
// ---------------------------------------------------------------
const showHL        = input.boolean('Show Prior Day High/Low', true);
const breakSessions = input.boolean('Break Lines at Session End', true);

// false = measure UP from prior low (fib 0 = low, fib 1 = high)
// true  = measure DOWN from prior high (fib 0 = high, fib 1 = low)
const fromHigh      = input.boolean('Measure From High', false);

const fib1 = input.number('Fib Level 1', 0,     { min: 0, max: 1 });
const fib2 = input.number('Fib Level 2', 0.236, { min: 0, max: 1 });
const fib3 = input.number('Fib Level 3', 0.382, { min: 0, max: 1 });
const fib4 = input.number('Fib Level 4', 0.5,   { min: 0, max: 1 });
const fib5 = input.number('Fib Level 5', 0.618, { min: 0, max: 1 });
const fib6 = input.number('Fib Level 6', 0.786, { min: 0, max: 1 });
const fib7 = input.number('Fib Level 7', 1,     { min: 0, max: 1 });
const fibArray = [fib1, fib2, fib3, fib4, fib5, fib6, fib7];

// Extensions - OFF by default. Each magnitude is drawn twice:
// once above the prior high, once below the prior low.
const showExt = input.boolean('Show Extensions', false);
const ext1 = input.number('Extension 1', 1.272, { min: 1, max: 5 });
const ext2 = input.number('Extension 2', 1.618, { min: 1, max: 5 });
const ext3 = input.number('Extension 3', 2,     { min: 1, max: 5 });
const extArray = [ext1, ext2, ext3];

// ---------------------------------------------------------------
// Palette: one neutral family + a single gold accent.
// All mid-luminance so nothing disappears on white or black.
// ---------------------------------------------------------------
const C_ANCHOR = '#607d8b'; // prior day H/L and 0% / 100% - slate
const C_LEVEL  = '#90a4ae'; // interior levels             - light slate
const C_GOLD   = '#c9a227'; // golden ratios               - gold

function isGolden(f) {
    return Math.abs(f - 0.618) < 0.02
        || Math.abs(f - 0.786) < 0.02
        || Math.abs(f - 1.618) < 0.02;
}

function isBoundary(f) {
    return f <= 0.001 || f >= 0.999;
}

function colorForFib(f) {
    if (isGolden(f))   return C_GOLD;
    if (isBoundary(f)) return C_ANCHOR;
    return C_LEVEL;
}

function thicknessForFib(f) {
    if (isGolden(f) || isBoundary(f)) return 2;
    return 1;
}

function styleForFib(f) {
    // 50% stays dotted so the midpoint reads without adding a color
    return (Math.abs(f - 0.5) < 0.02) ? 'dotted' : 'line';
}

// ---------------------------------------------------------------
// Daily data -> prior day high / low landed on the intraday series
// ---------------------------------------------------------------
const data = await request.history(constants.ticker, 'D');

const priorDayHigh = shift(data.high, 1);
const priorDayLow  = shift(data.low, 1);

const intradayHigh = land_points_onto_series(data.time, priorDayHigh, time);
const intradayLow  = land_points_onto_series(data.time, priorDayLow, time);

// ---------------------------------------------------------------
// Session-end detection
// Land each daily bar's timestamp on the intraday series, hold it
// constant, then flag any bar whose next bar belongs to a new day.
// ---------------------------------------------------------------
const dayStamp = interpolate_sparse_series(
    land_points_onto_series(data.time, data.time, time), 'constant'
);

const lastIdx = dayStamp.length - 1;
const sessionEnd = dayStamp.map((d, i) => {
    if (i >= lastIdx) return false;          // never blank the live bar
    return dayStamp[i + 1] !== d;            // final candle of the day
});

function applyBreaks(series) {
    if (!breakSessions) return series;
    return series.map((v, i) => (sessionEnd[i] ? null : v));
}

// ---------------------------------------------------------------
// Level builder
// mode 'retrace' respects the Measure From High toggle.
// mode 'up' / 'down' are always absolute: 'up' projects above the
// prior high, 'down' below the prior low, regardless of anchor.
// ---------------------------------------------------------------
function buildLevel(fib, mode) {
    return intradayLow.map((priorLow, i) => {
        const priorHigh = intradayHigh[i];
        if (priorLow === null || priorHigh === null) return null;
        const range = priorHigh - priorLow;
        if (mode === 'up')   return priorLow + range * fib;
        if (mode === 'down') return priorHigh - range * fib;
        return fromHigh ? priorHigh - range * fib : priorLow + range * fib;
    });
}

// Every series is always painted so the registered series count never
// changes between runs. Hidden series are painted as all-null instead
// of being skipped.
function paintLevel(fib, mode, seriesName, showLine) {
    const visible = (showLine === undefined) ? true : showLine;
    paint(visible
        ? applyBreaks(interpolate_sparse_series(buildLevel(fib, mode), 'constant'))
        : series_of(null), {
        style: mode === 'retrace' ? styleForFib(fib) : 'dotted',
        color: colorForFib(fib),
        thickness: thicknessForFib(fib),
        name: seriesName
    });
}

// ---------------------------------------------------------------
// Paint
// ---------------------------------------------------------------
paint(showHL ? applyBreaks(interpolate_sparse_series(intradayHigh, 'constant')) : series_of(null), {
    style: 'line', color: C_ANCHOR, thickness: 2, name: 'Prior Day High'
});
paint(showHL ? applyBreaks(interpolate_sparse_series(intradayLow, 'constant')) : series_of(null), {
    style: 'line', color: C_ANCHOR, thickness: 2, name: 'Prior Day Low'
});

// Static series names avoid the "already exists" error when two
// inputs are set to the same value.
const fibNames = ['Fib 1', 'Fib 2', 'Fib 3', 'Fib 4', 'Fib 5', 'Fib 6', 'Fib 7'];
fibArray.forEach((f, index) => paintLevel(f, 'retrace', fibNames[index], true));

const upNames   = ['Ext Up 1', 'Ext Up 2', 'Ext Up 3'];
const downNames = ['Ext Down 1', 'Ext Down 2', 'Ext Down 3'];
extArray.forEach((f, index) => {
    paintLevel(f, 'up', upNames[index], showExt);
    paintLevel(f, 'down', downNames[index], showExt);
});Traders also viewed