Disclaimer
All information shown on this page is for illustrative purposes only and should not be construed as investment, financial, market or other advice. Any information shown on this page that purports to be based upon past or current market conditions may not be complete, timely or accurate and, in any event, is not predictive of future outcomes.
Report This Indicator
(Consolidation Range Detector [Pt])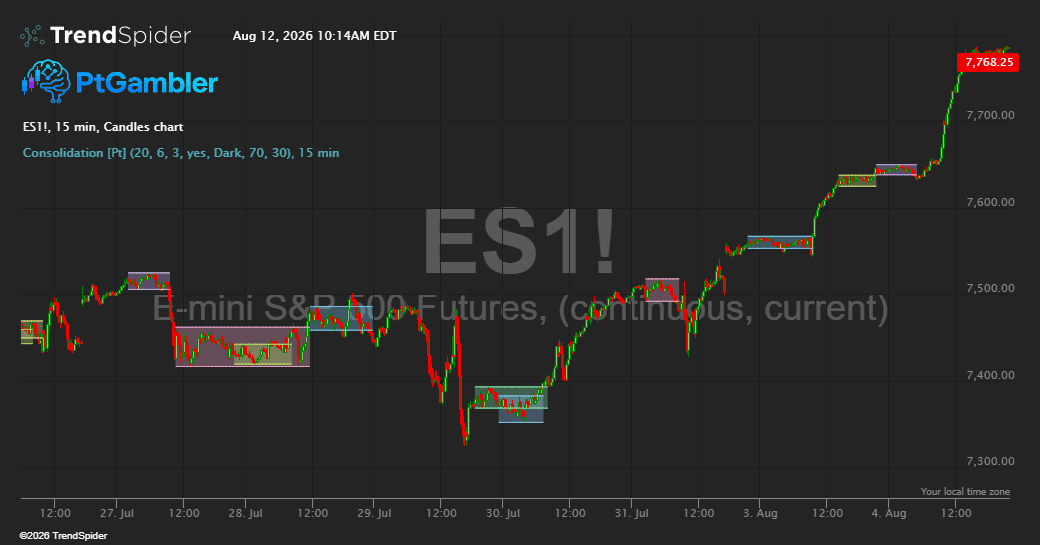
Consolidation Range Detector [Pt]
Markets do not always move in a clear direction. Price often pauses and moves sideways within a limited area before continuing, reversing, or breaking into a new trend.
The Consolidation Range Detector [Pt] automatically finds these sideways periods and highlights them with colored boxes. Each box shows the upper and lower boundaries of the range, giving you clear price levels to watch without having to draw them manually.
How This Tool Can Help
A consolidation range can provide useful context for planning a trade:
- Recognize sideways markets: Quickly see when price is contained within a range instead of moving in a clear trend.
- Find important price levels: Use the top and bottom of each box as potential resistance and support areas.
- Watch for breakouts: A clear move beyond the range may signal that price is beginning a stronger move.
- Spot failed breakouts: If price briefly moves outside the range and returns, the range may still be influencing the market.
- Improve trade planning: Use the range boundaries as reference points when considering entries, exits, targets, or risk.
- Avoid unclear conditions: Traders who prefer trending markets can use the highlighted ranges to recognize periods of sideways or choppy price action.
- Review previous ranges: Historical boxes remain visible so you can see whether old consolidation levels continue to affect price.
Key Features
- Automatically detects and highlights established consolidation ranges.
- Filters out loose or poorly formed ranges to keep the chart more useful.
- Keeps the upper and lower boundaries fixed after a range is confirmed.
- Extends each box while price remains within or near the range.
- Supports multiple and overlapping ranges.
- Keeps completed ranges visible for later reference.
- Offers fixed or varied colors for easier chart reading.
- Includes color settings for dark, light, and neutral chart backgrounds.
Settings
- Minimum Detection Bars: Sets how long price must remain in an area before it can be recognized as a consolidation range. Higher values look for longer-lasting ranges.
- Max Range, ATR Multiplier: Controls how wide a detected range is allowed to be based on the market’s recent price movement. Lower values look for tighter ranges, while higher values allow wider ones.
- Detection Sensitivity: Controls how closely price must follow the range boundaries. Higher values look for cleaner and more tightly defined ranges.
- Range Color: Selects the box color when varied colors are turned off.
- Use Varied Colors: Uses different colors to make separate or overlapping ranges easier to distinguish.
- Color Scheme (Background): Selects colors suited to dark, light, or neutral chart backgrounds.
- Color Transparency: Controls the transparency of the highlighted area.
- Border Transparency: Controls the visibility of the upper and lower range boundaries.
Using the Indicator
The tool is intended to provide market context, not predict what price will do next. Price may break above a range, break below it, or remain inside it for an extended period.
Consider the range boundaries together with price action, volume, trend direction, and your existing trading method before making a decision.
Traders also viewed