Disclaimer
All information shown on this page is for illustrative purposes only and should not be construed as investment, financial, market or other advice. Any information shown on this page that purports to be based upon past or current market conditions may not be complete, timely or accurate and, in any event, is not predictive of future outcomes.
Report This Indicator
(Kodexius Trend Lines)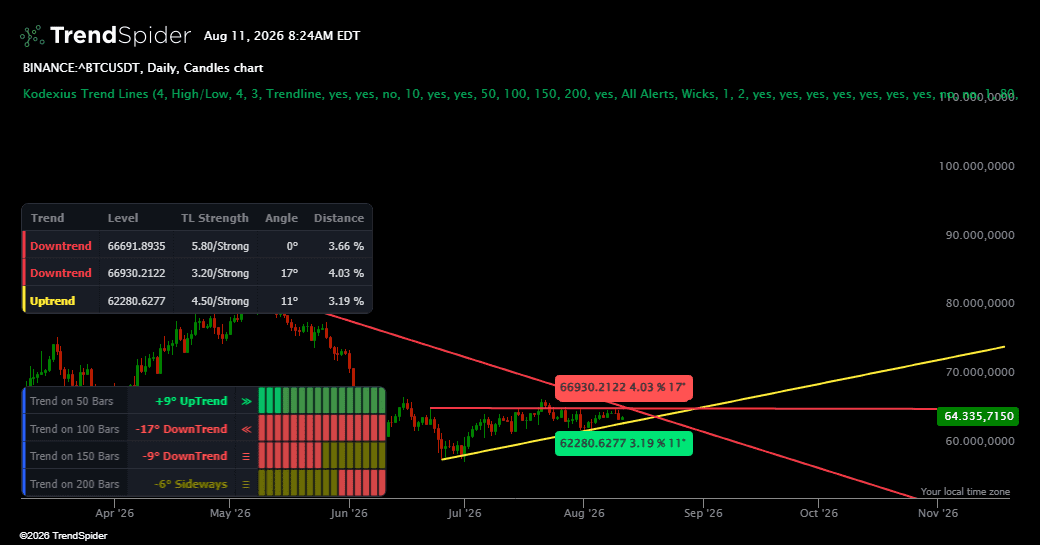
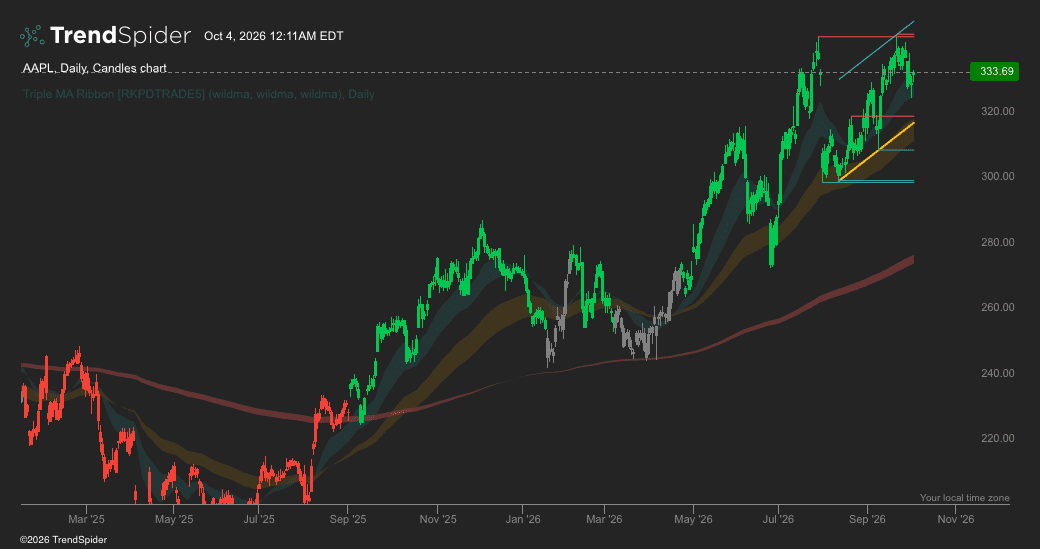
Kodexius Trend Lines is a professional market structure indicator designed to make directional price behavior easier to read, compare, and monitor. It brings active rising and falling trend structures together in one clear visual environment, helping traders identify relevant support, resistance, compression, continuation, and structural change without overcrowding the chart.
The indicator presents multiple active trend lines when valid structures are available. This provides both immediate context near current price and a broader view of the boundaries that may influence future movement. Projected levels remain easy to follow as new market data arrives, while optional labels provide practical information such as level, angle, and percentage distance.
Four visual modes allow the presentation to suit different workflows. Traders can focus on individual trend lines, compact channels, complete trend channels, or channels with a middle reference line. Optional channel shading, pivot markers, broken structure tracking, and an angle bisector provide additional context without forcing unnecessary elements onto every chart.
Two integrated dashboards organize the most important information into a clean dark interface. The trend line dashboard summarizes direction, projected level, structural strength, angle, and distance. The market structure dashboard evaluates four observation lengths and presents directional state, momentum behavior, and recent structural history through a compact visual display.
Kodexius Trend Lines also supports TrendSpider alerts, scanners, and strategy workflows through a comprehensive collection of dedicated signals. These signals cover trend line breaks, channel interaction, rebounds, proximity events, structural convergence, new trend formation, large angle conditions, pivot events, directional availability, and market structure transitions.
Kodexius Trend Lines is an analytical decision support tool and does not provide financial advice. It should not be treated as a guarantee of future price behavior or used as the sole basis for a trading decision.
🔹 Key Features
Automated Trend Structure
Presents relevant rising and falling trend structures without requiring continuous manual line maintenance.
Multiple Active Trend Lines
Displays nearby and broader directional boundaries together when valid structures are available.
Four Visual Modes
Includes Trendline, Channel, Trend Channel, and Trend Channel With Midline presentations.
Strength and Angle Context
Provides clear structural strength and normalized angle information for faster comparison.
Projected Price Levels
Shows current projected support and resistance levels with optional angle and distance details.
Trend Line Dashboard
Summarizes direction, level, strength, angle, and distance in a compact professional panel.
Market Structure Dashboard
Evaluates four configurable observation lengths with direction, momentum, and visual history.
Broken Structure Tracking
Highlights recently broken structures and can display labels at relevant break levels.
Advanced Structure Filters
Allows visible structures to be filtered through angle and price distance preferences.
Angle Bisector
Provides an optional reference between the nearest rising and falling structures.
Pivot Point Display
Adds optional pivot markers for traders who want more detailed structural context.
Alert and Scanner Support
Offers dedicated signals for TrendSpider alerts, market scanners, and strategy workflows.
Clean Professional Interface
Uses compact dark dashboards, clear typography, restrained accents, and organized visual hierarchy.
Multi Market Compatibility
Designed for use across different instruments and chart resolutions with sufficient price history.
Traders also viewed