Disclaimer
All information shown on this page is for illustrative purposes only and should not be construed as investment, financial, market or other advice. Any information shown on this page that purports to be based upon past or current market conditions may not be complete, timely or accurate and, in any event, is not predictive of future outcomes.
Report This Indicator
(MACD Consensus Average Divergence)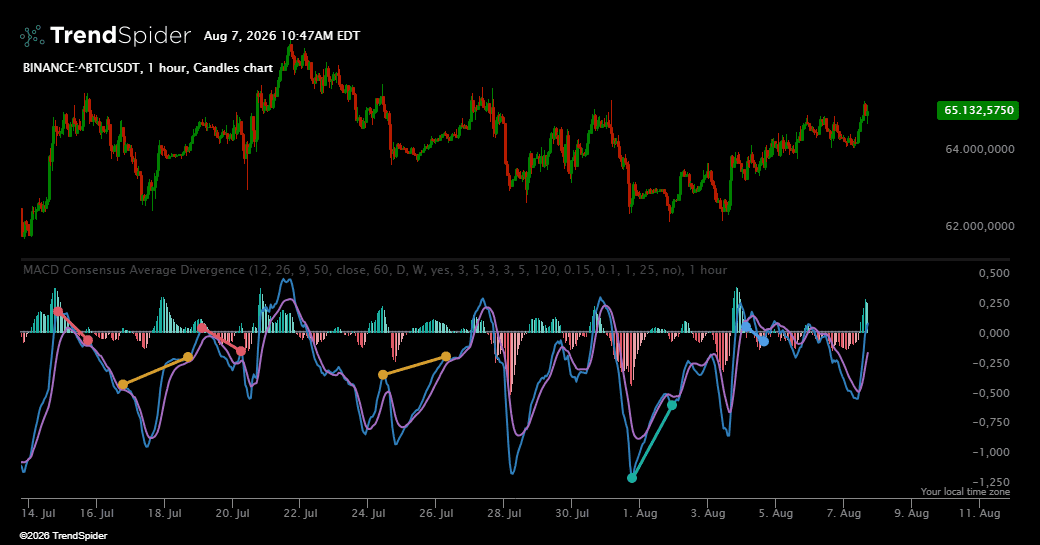
MACD Consensus Average Divergence is a professional momentum indicator that presents several timeframe perspectives in one clean oscillator window. It helps traders evaluate whether short term momentum is developing in harmony with broader market structure or moving against it, without reviewing multiple separate MACD panels.
Purpose
Traditional MACD analysis reflects only the timeframe displayed on the chart. This can make meaningful momentum transitions difficult to separate from temporary noise. The indicator provides broader context while keeping analysis organized and easy to read.
Visual Interpretation
The main MACD line represents the combined momentum view. The signal line offers a smoother directional reference, while the histogram displays the distance between them. Expanding columns indicate increasing momentum pressure. Contracting columns suggest weakening pressure. The zero line separates positive and negative momentum regimes.
Divergence Analysis
The indicator identifies regular and hidden bullish and bearish divergences. Regular divergence can highlight potential momentum exhaustion and reversal areas. Hidden divergence can support continuation analysis during an established trend. Clear lines and compact pivot markers identify the oscillator swings associated with completed signals.
Trading Applications
The indicator supports trend analysis, momentum confirmation, reversal research, continuation setups, scanning, alerts, and strategy testing. It can be applied to stocks, exchange traded funds, futures, forex, and digital assets where sufficient history is available.
Recommended Use
This indicator is an analytical confirmation tool, not a complete trading system. Momentum readings are best considered alongside price structure, support and resistance, liquidity, volume, and disciplined risk management. Divergence can remain present while a trend continues, so price confirmation remains important.
🔹 Key Features
Unified Multiple Timeframe MACD
Combines selected timeframe perspectives into one coherent MACD presentation and reduces repeated chart switching.
Balanced Timeframe Contribution
Keeps different timeframe readings visually comparable within the complete momentum view.
Duplicate Timeframe Protection
Prevents repeated timeframe selections from unintentionally increasing the influence of one interval.
Confirmed Timeframe Data Option
Offers completed requested timeframe readings for traders who prefer greater stability.
Complete Divergence Suite
Detects regular bullish, regular bearish, hidden bullish, and hidden bearish divergence conditions.
Consensus Based Confirmation
Uses the available timeframe perspective to reduce dependence on an isolated momentum reading.
Matched Pivot Markers
Marks the oscillator pivot endpoints paired with meaningful price swings without overcrowding the oscillator panel.
Professional Histogram Display
Distinguishes positive expansion, positive contraction, negative expansion, and negative contraction.
Flexible Market Structure Controls
Adjustable structure, separation, participation, and agreement settings support different instruments and trading horizons.
Scanner and Alert Compatibility
Confirmed divergence signals are available in Market Scanner, Multi Factor Alerts, Strategy Tester, and Visual Script workflows.
Theme Friendly Presentation
The color palette remains readable across dark and light chart themes.
Broad Market Compatibility
Supports multiple asset classes and a wide selection of timeframes, subject to data availability.
Risk Notice
Provided for analytical and educational purposes only. It does not provide financial advice, guarantee results, or replace independent research and appropriate risk controls.
Traders also viewed