Disclaimer
All information shown on this page is for illustrative purposes only and should not be construed as investment, financial, market or other advice. Any information shown on this page that purports to be based upon past or current market conditions may not be complete, timely or accurate and, in any event, is not predictive of future outcomes.
Report This Indicator
(Perceptual Drawing Economy Map)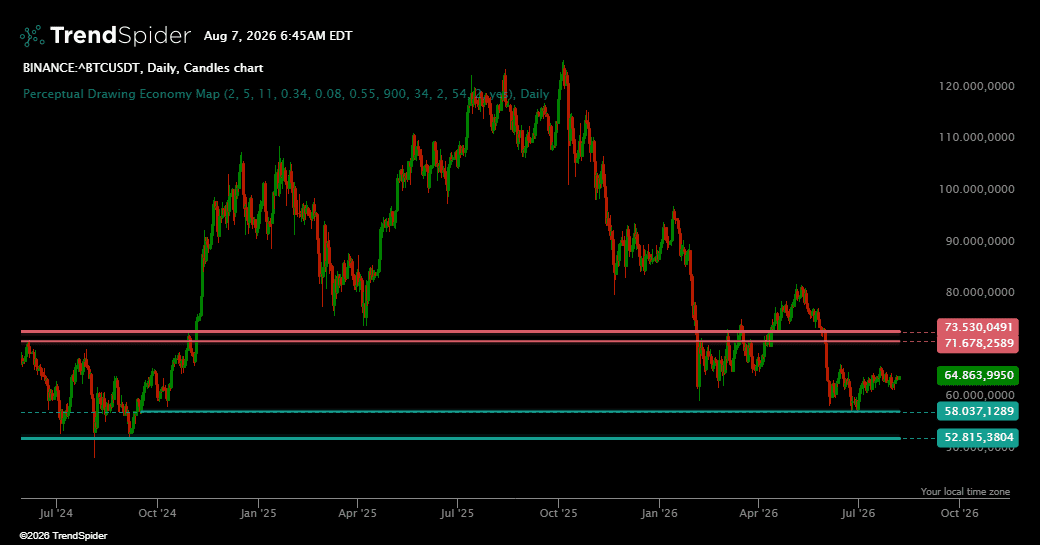
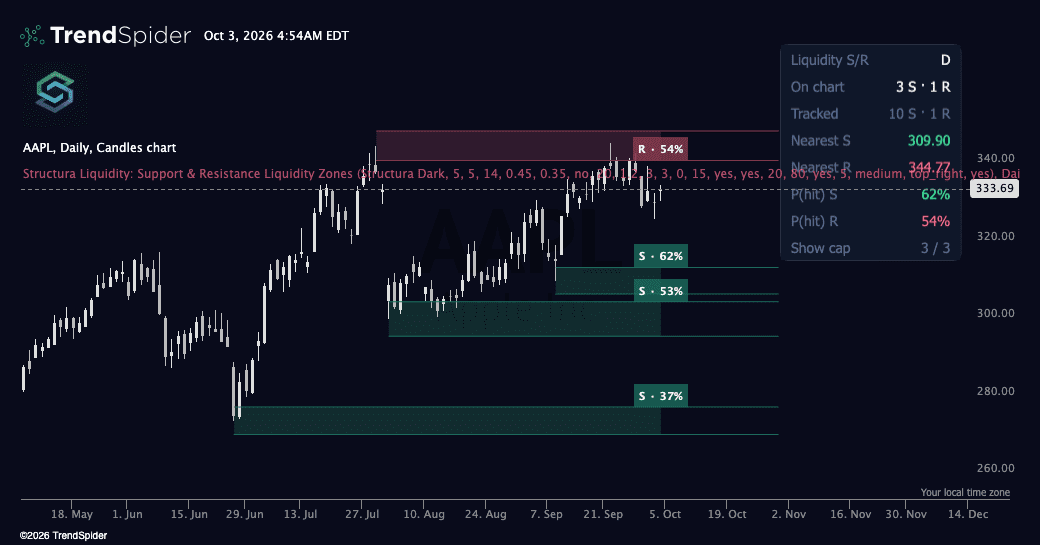
Perceptual Drawing Economy Map is designed for traders who want a cleaner and more selective view of the price areas that market participants are most likely to recognize. Instead of filling the chart with every possible turning point, it presents a limited map of current support and resistance areas that appear relevant to collective market attention.
Support and resistance are rarely exact prices. Traders often interpret nearby prices as one shared decision area. The indicator therefore displays structured zones with clear center levels, helping users distinguish meaningful areas from ordinary market noise.
The current map is reassessed as new candles become available. A level can gain or lose relevance as market conditions evolve. Historical line extensions provide context for the current map and should not be interpreted as a fixed record of levels known at every point in the past.
The indicator is intended for visual chart analysis and is designed to complement market structure, trend, momentum, volume, and risk management. It does not predict guaranteed reversals or represent direct order book positioning or drawings collected from other traders.
🔹 Key Features
🔸 Consensus Oriented Level Selection
Focuses attention on price areas that are more likely to be broadly recognized, while filtering minor fluctuations that can make conventional tools difficult to read.
🔸 Selective Current Market Map
Displays a limited number of relevant levels on each side of price, reducing the visual overload created by large collections of historical lines.
🔸 Structured Price Zones
Represents support and resistance as areas rather than unrealistically precise prices. Each level can include a center line and surrounding zone for clearer planning.
🔸 Priority Based Presentation
Organizes levels by current relevance. The primary level receives the strongest emphasis, while secondary levels provide context without competing for equal attention.
🔸 Economical Market Presentation
Prioritizes a compact set of meaningful areas instead of presenting multiple levels that communicate the same market information.
🔸 Chart Focused Operation
Keeps the current visual map separate from scanning and historical strategy conditions, preventing a changing present day map from being mistaken for a fixed historical signal record.
🔸 Noise Controlled Visual Design
Uses distinct colors, ranked line thickness, optional zones, and symbol appropriate price precision. The presentation remains readable on light and dark chart themes.
🔸 Market Adaptive Behavior
Responds to the price scale, changing volatility, and available participation data of the active symbol. Usable volume data is required.
🔸 Flexible User Controls
Provides controls for visual sensitivity, agreement bands, memory depth, minimum selection quality, displayed level count, visibility, and colors. Defaults are intentionally selective.
🔸 Broad Workflow Compatibility
Suitable for planning entries and exits, placing alerts near relevant zones, evaluating break behavior, and adding structure to trend following or mean reversion workflows.
🔸 Responsible Interpretation
Estimates areas of likely shared market attention from chart behavior. It does not observe private drawings, exchange orders, or future activity. Every level requires independent confirmation and appropriate risk management.
Traders also viewed