Disclaimer
All information shown on this page is for illustrative purposes only and should not be construed as investment, financial, market or other advice. Any information shown on this page that purports to be based upon past or current market conditions may not be complete, timely or accurate and, in any event, is not predictive of future outcomes.
Report This Indicator
(Polynomial Trend Lines)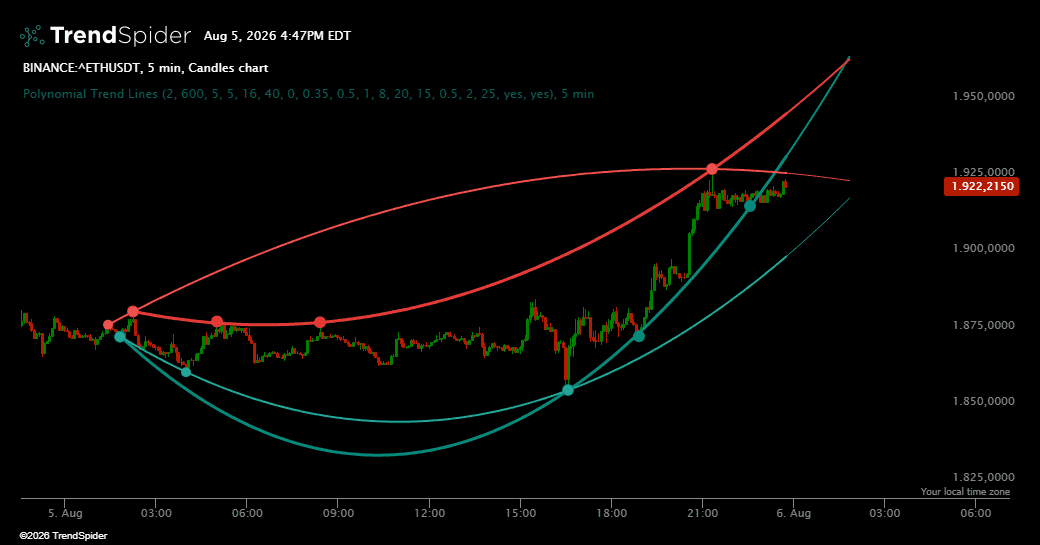
Polynomial Trend Lines is a professional market structure indicator designed to identify curved support and resistance relationships that traditional straight trend lines may overlook. Markets do not always develop at a constant rate. Momentum can accelerate, weaken, or transition gradually, creating structures that are better represented by smooth curves than by fixed linear boundaries.
The indicator presents the most relevant active support and resistance curves directly on the price chart. It is built for traders who want a clearer view of evolving market geometry, especially during rounded advances, controlled declines, accumulation phases, distribution phases, and trends with changing velocity.
Each displayed curve is supported by meaningful interaction with price action. Visible touch markers make important reaction points easy to recognize, while the ranked line structure helps distinguish the strongest levels from secondary market boundaries. This creates a clean visual framework for evaluating continuation, rejection, compression, expansion, and potential structural breaks.
Polynomial Trend Lines can support discretionary analysis across multiple markets and time frames. It may be used as a standalone market structure tool or combined with volume, momentum, volatility, candlestick confirmation, and broader trend analysis. The indicator is intended to improve context and consistency, not to replace risk management or independent trading judgment.
🔹 Key Features
Curved Market Structure
Reveals support and resistance relationships that develop through changing trend velocity and may not align naturally with straight lines.
Dynamic Support and Resistance
Displays active curved boundaries above and below price, providing a structured view of potential reaction zones and directional pressure.
Visible Touch Confirmation
Highlights the price interactions associated with each selected curve, allowing traders to evaluate the visual significance of a level quickly.
Quality Focused Line Selection
Prioritizes the most relevant market structures while filtering weaker, unstable, or visually redundant curves from the chart.
Quadratic and Cubic Modes
Offers two curvature profiles so traders can choose between smoother broad structures and more flexible market formations.
Multiple Ranked Levels
Displays two support curves and two resistance curves by default, with the option to show one, two, or three levels per side. Color and line thickness provide a clear visual ranking.
Forward Curve Projection
Extends selected structures beyond the latest candle to help traders observe how current market geometry may develop into upcoming price areas.
Volatility Aware Behavior
Interprets touches, distance, and structural relevance in relation to current market volatility, improving consistency across different assets and time frames.
Confirmed Market Pivots
Uses established swing structure to reduce noise and focus the display on meaningful market reactions rather than minor price fluctuations.
Clean Visual Hierarchy
Separates support, resistance, touch points, and projected curves with a professional color system suitable for both light and dark chart themes.
Flexible Sensitivity Controls
Provides control over analysis depth, pivot sensitivity, touch requirements, structural tolerance, curve separation, projection distance, and the number of active levels.
Broad Market Compatibility
Designed for use with stocks, exchange traded funds, futures, forex, and digital assets across intraday, swing, and position trading workflows.
Decision Support for Multiple Setups
Useful for studying curved trend continuation, dynamic pullbacks, rejection areas, compression, acceleration, exhaustion, breakouts, breakdowns, and potential role reversals.
Traders also viewed