Disclaimer
All information shown on this page is for illustrative purposes only and should not be construed as investment, financial, market or other advice. Any information shown on this page that purports to be based upon past or current market conditions may not be complete, timely or accurate and, in any event, is not predictive of future outcomes.
Report This Indicator
(Spiking Graph: Real Machine Learning Concepts)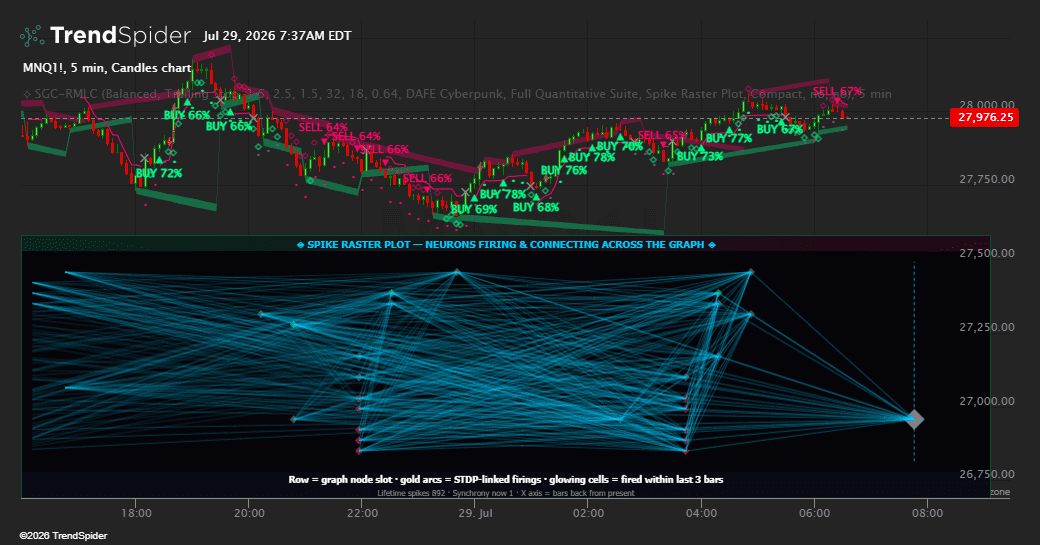
Spiking Graph: Real Machine Learning Concepts (SGC-RMLC)
By: Dskyz | DAFE Trading Systems
Most “AI” indicators are costumes—moving averages with a sticker. SGC-RMLC is a live Spiking Neural Network running directly on your chart, learning real liquidation cascades as they form.
How it works—in 3 steps:
Price levels (support, resistance, POC, VAH, VAL, EMAs) are neurons. Price stress charges them up. They fire and inject energy into connected levels through learned weights (STDP—unsupervised Hebbian learning, not fake backprop). When one level breaks, the cascade flows down the ladder mechanically—just like real liquidation contagion. The engine self-tunes its firing speed, memory, and learning rate from the market’s own dominant cycle (FFT spectral engine). No arbitrary guesses.
Every system updated with guides:
- Input Guide—every menu item explained in plain language.
- Visual Guide—every chart line, color cloud, badge, lower-panel mode, and dashboard readout explained.
What you control (the only things that matter):
- Preset Mode—sets signal speed, alignment strictness, and chop tolerance at once (Standard / Balanced / High-Frequency / Aggressive Scalp).
- Exit Strategy—Trailing Stop, ATR Target/Stop, Signal Reversal, or Time Stop.
- Risk Multipliers—Stop Loss, Take Profit, Trailing Stop (all in ATR multiples).
- Max Hold Bars—hard time cap on any trade.
- Max Graph Nodes—how many structural levels track (6 fixed anchors + fresh pivots).
- Signal Threshold—probability the fused score must clear (0.50 loose → 0.80+ very selective).
- Display Suite—Full / Signals-Only / Bands-Only / Minimal chart clutter.
- Lower Panel—Spike Raster / Force-Directed Cascade Graph / Membrane Potential Traces / Synaptic Weight Heatmap.
- Visual Density—how much history renders.
- Intrabar Preview—see live orange “LIVE” signals form on the current bar; they relabel to normal ▲/▼ on close—zero repainting.
- Dashboard Toggle—real-time metrics on/off.
What you see on chart:
- ▲ BUY / ▼ SELL badges with live confidence %
- Cascade Flow Cloud—green/red momentum intensity
- Structural Corridors—projected resistance/support rails
- Equilibrium Band—synthetic POC + Value Area (gold/purple)
- Field Rug—trend-state dots below price (green up / red down / gray chop)
- Active Stop / Target lines—live exit levels
- Watch markers (◇)—near-miss probabilities
- Thrash markers (⚡)—whipsaw lockout active
- Exit markers (✕)—logged trade closes
Dashboard (top-right) reads live:
Field State + open position | Integrity % | Active nodes / firing threshold | Cascade depth / synchrony / node bias | Adaptive engine parameters (τ, refractory, STDP window, cascade window, γ scale, AGC threshold, annealing learning rate) | 5-Expert Fusion (Cascade, Bias, Membrane, Delta, Field) | Cauchy probability | Cooldown status | Full trade stats—win rate, profit factor, expectancy, max drawdown, streak, exit-reason mix.
Four lower-panel neuron views:
- Raster—firing timeline + gold STDP co-fire links
- Force Graph—live network: Y = price offset, X = neuron charge, gold edges = active synapses
- Membrane Traces—raw LIF voltage curves for 6 anchors + 4 busiest pivots; sawtooth resets; dashed threshold line
- Heatmap—full row→column learned weight matrix; gold = potentiated, faded = suppressed, bright ring = just updated
Limits (know them):
Delta synthesized from candles/volume—not tick-level. FFT needs ~64 bars warmup. STDP weights mature with activity. Not a certified black-box printer—this is a research-grade nervous system that reveals cascade mechanics, not a guarantee.
Contagion over crossing. Plasticity over amnesia. Cascade over myth.
The graph spikes. The synapses learn. The cascade reveals itself.
Traders also viewed