Disclaimer
All information shown on this page is for illustrative purposes only and should not be construed as investment, financial, market or other advice. Any information shown on this page that purports to be based upon past or current market conditions may not be complete, timely or accurate and, in any event, is not predictive of future outcomes.
Report This Indicator
(RSI Reversal Probability)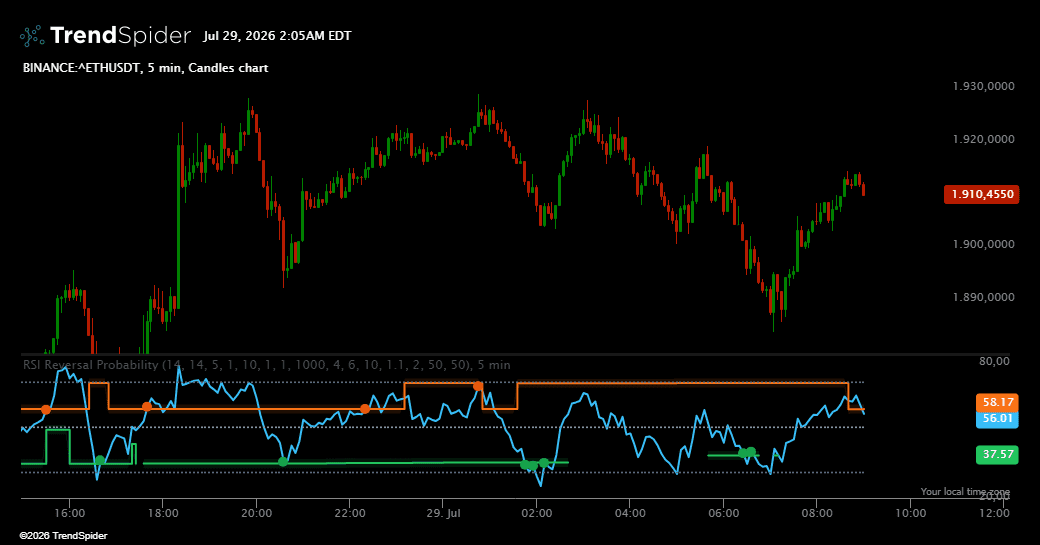
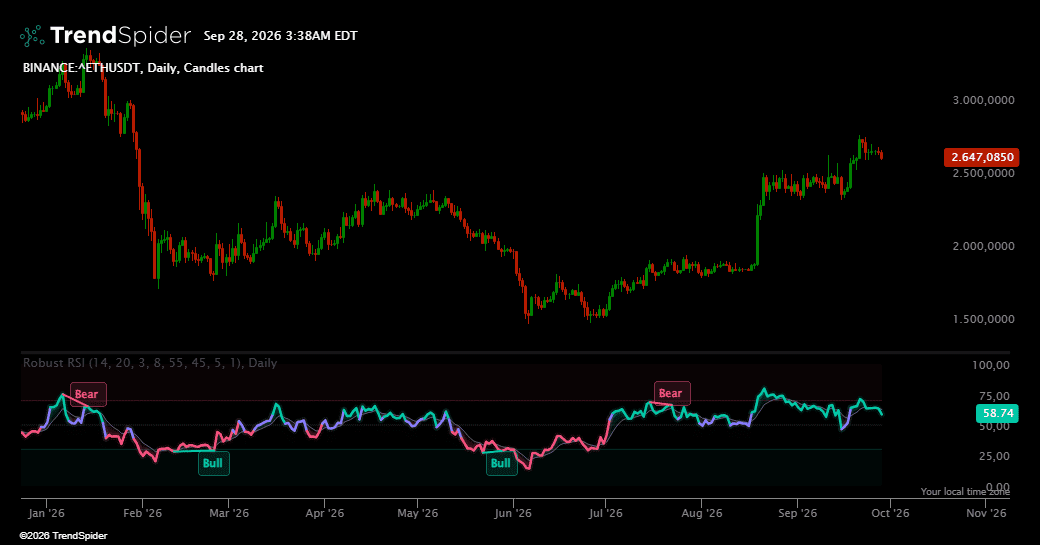
RSI Reversal Probability is a professional momentum oscillator designed to help traders identify areas where price may be approaching a meaningful change in direction. Instead of treating traditional RSI levels as universal rules, the indicator presents reversal zones that reflect the behavior of the selected market and chart interval.
The main RSI line shows current momentum, while separate bullish and bearish zones highlight areas associated with historically important changes in direction. These zones can evolve as market conditions change, providing a more relevant perspective than relying only on fixed overbought and oversold levels.
Bullish and bearish signal markers are displayed directly inside the oscillator panel. This keeps momentum, reversal zones, and recent signal events together in one clear view. Traditional RSI reference levels remain visible for familiar context, but the market specific zones provide the primary analytical framework.
The indicator supports intraday, swing, and longer term analysis across many markets. Results depend on the historical chart data available, so sufficient candles should be loaded before evaluating the displayed levels.
RSI Reversal Probability is a decision support tool rather than a complete trading system. Signals should be considered with price structure, trend, support and resistance, volume, volatility, and risk management. Historical behavior cannot guarantee future results. Users should test the indicator before applying it to live decisions.
🔹 Key Features
Market Specific Reversal Zones
Bullish and bearish RSI areas reflect the behavior of the selected market, offering a more relevant reference than using the same fixed threshold for every instrument.
Separate Bullish and Bearish Analysis
Upside and downside reversal conditions are presented independently, recognizing that buying pressure and selling pressure can behave differently.
Evolving Market Awareness
Reversal zones can adjust as market behavior changes, helping the indicator remain useful across trending, ranging, calm, and volatile conditions.
Clear Oscillator Layout
Current RSI, reversal zones, signal markers, and traditional reference levels are organized within one dedicated lower panel for efficient visual analysis.
Visual Signal Markers
Compact green and orange markers highlight newly identified bullish and bearish reversal events without overwhelming the RSI display.
Probability Context
Optional bullish and bearish probability outputs provide additional context for traders who want a deeper view. These outputs remain hidden by default to preserve a clean chart.
Configurable Sensitivity
Users can adjust the indicator for different assets, intervals, and trading styles. Settings can support responsive short term analysis or more selective longer term evaluation.
Historical Quality Controls
The indicator requires sufficient supporting observations before presenting a qualified reversal area, helping reduce conclusions based on extremely limited information.
Scanner and Alert Compatibility
Dedicated bullish and bearish outputs can be used within TrendSpider Visual Scripts for scanners, alerts, strategy testing, and related platform workflows.
Confirmation Oriented Design
RSI Reversal Probability complements price action, trend tools, volume studies, support and resistance analysis, and volatility indicators. It is designed to strengthen a broader process rather than replace confirmation.
Risk Conscious Presentation
Signals identify areas worthy of attention and do not represent certainty. Trade selection, position sizing, stop placement, and portfolio risk remain the responsibility of the user.
Traders also viewed