Indicator Disclaimer
|
Report this indicator
Disclaimer
All information shown on this page is for illustrative purposes only and should not be construed as investment, financial, market or other advice. Any information shown on this page that purports to be based upon past or current market conditions may not be complete, timely or accurate and, in any event, is not predictive of future outcomes.
Report This Indicator
(Awesome Oscillator with Signal)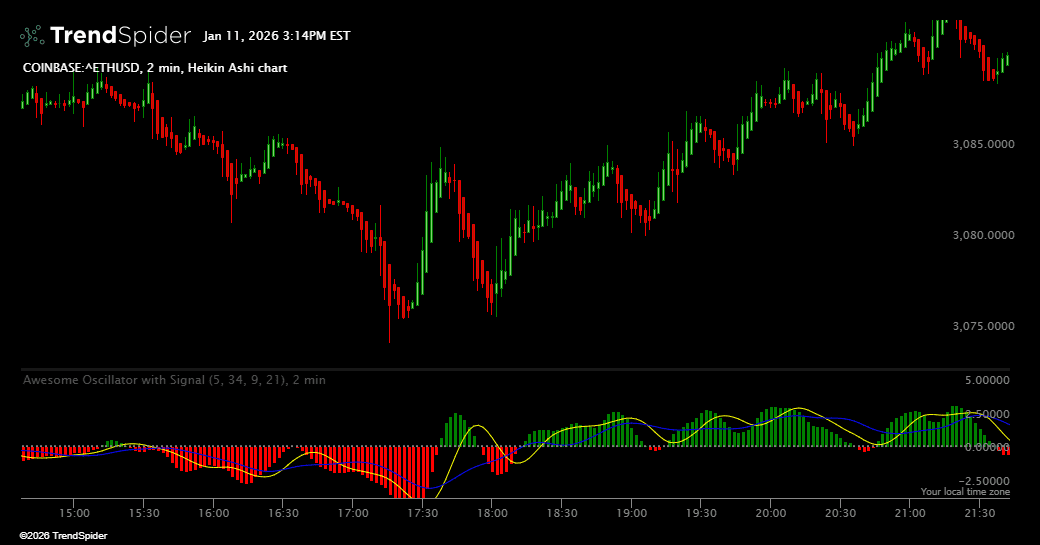
Awesome Oscillator with SMA 5 yellow and 21 blue added. when the histograms go over fast EMA 5, it means bullish, when it go over both fast and slow 5 and 21 EMAS that means more strength to the bullish trend. when the histograms go below fast EMA 5, it means bearish, when it go below both fast and slow 5 and 21 EMAS that means more strength to the bearish trend.
Traders also viewed
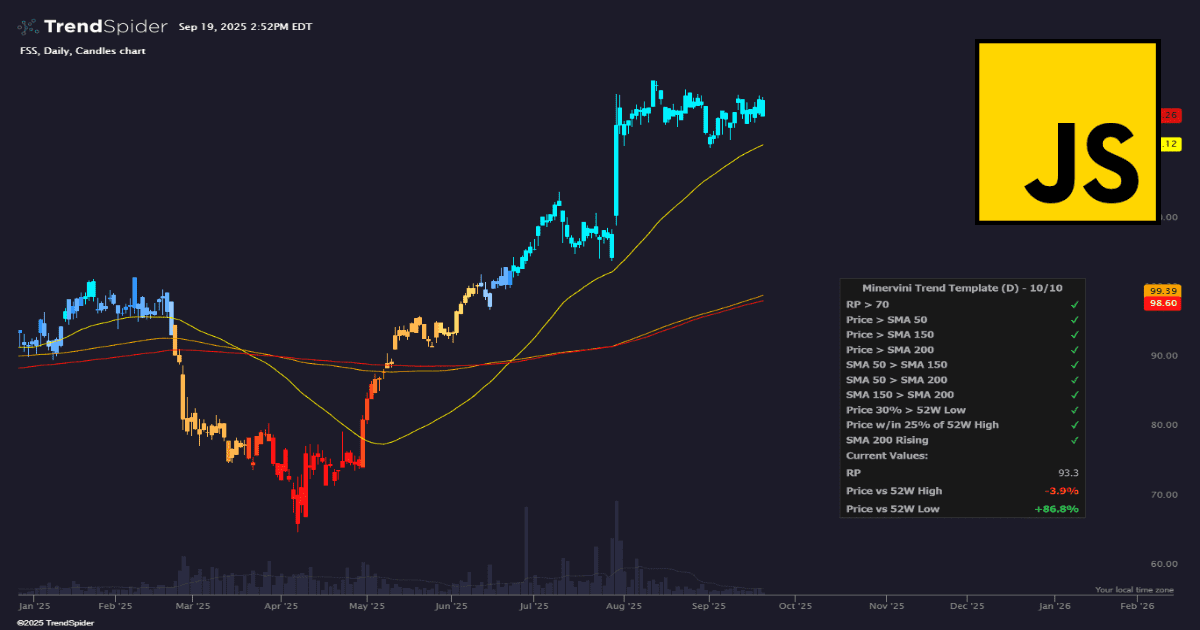
Minervini Trend Template
This indicator applies Mark Minervini’s exact Trend Template, a set of technical conditions used to identify true market leaders in strong, healthy uptrends. Each candle is color-coded based on how...
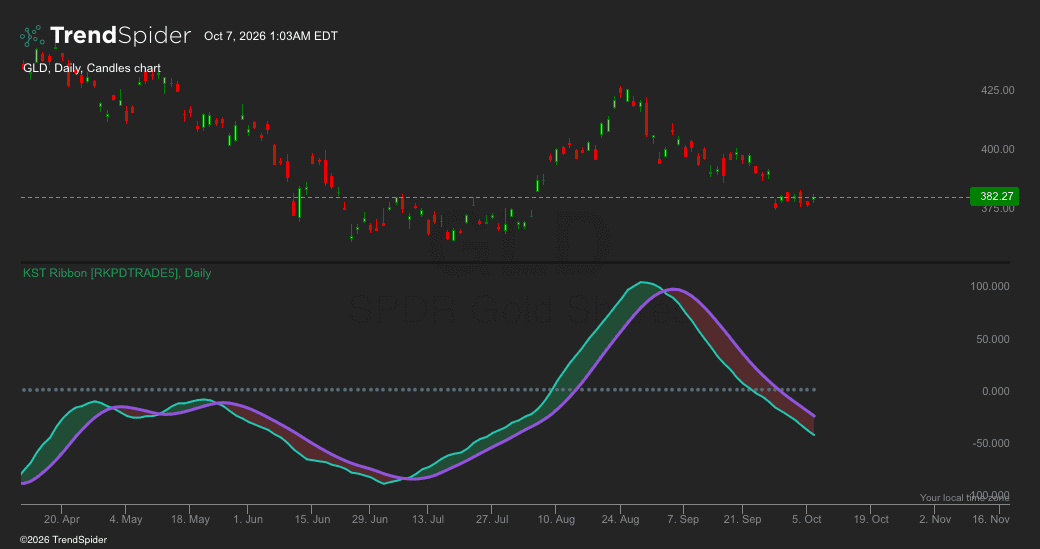
KST Ribbon [RKPDTRADE5]
KST Ribbon [RKPDTRADE5] is a momentum and trend-confirmation oscillator designed to make shifts in market momentum easier to recognize visually. The indicator combines multiple smoothed Rate of Change calculations across...
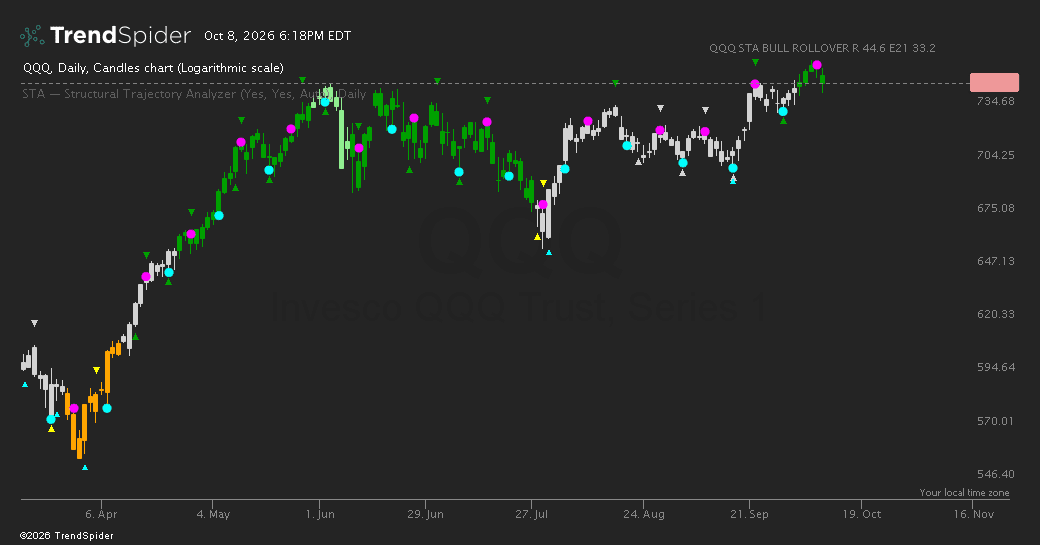
STA — Structural Trajectory Analyzer
#TSBuild26 STA (Structural Trajectory Analyzer) is a multi-scale market structure indicator developed primarily for SPY and QQQ. It tracks how short-, medium-, and long-term price dynamics interact to help identify...
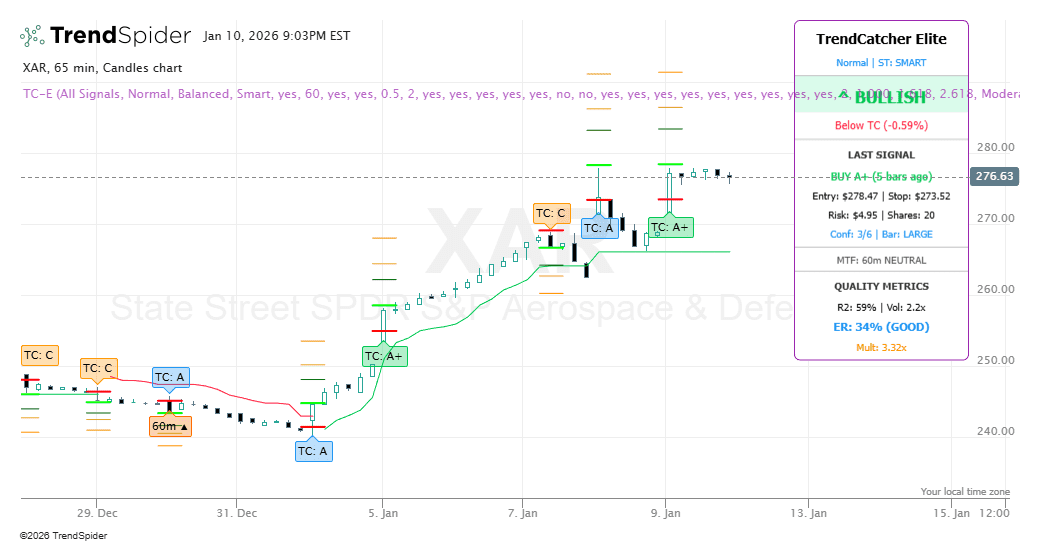
TrendCatcher Elite
TrendCatcher Elite A Complete Trading System — Entry to Exit, All Calculated TrendCatcher Elite isn't an indicator — it's a methodology. Every signal is graded. Entry, stop, and targets are...
MACD-Cast
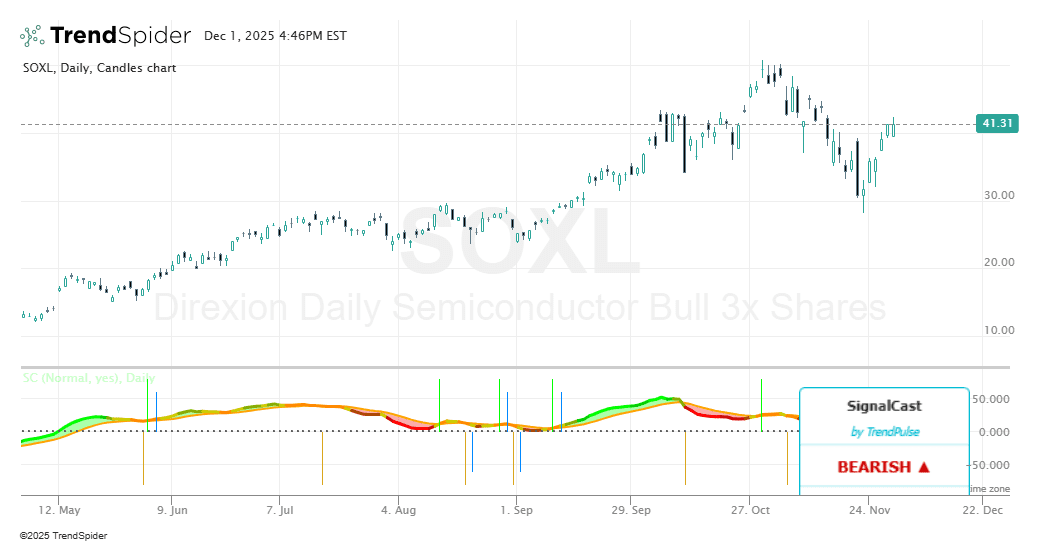
📊 MACD-Cast by TrendPulse See Crossovers Before They Happen MACD is the world's most popular indicator. We made it predict the future. Every platform has free MACD. So why pay...

SignalCast
SignalCast by TrendPulse Only $3.99/month 🚀 SignalCast Smoother Than RSI. Faster Than MACD. RSI whipsaws you out of good trades. MACD catches trends after the move already happened. You're stuck...