Disclaimer
All information shown on this page is for illustrative purposes only and should not be construed as investment, financial, market or other advice. Any information shown on this page that purports to be based upon past or current market conditions may not be complete, timely or accurate and, in any event, is not predictive of future outcomes.
Report This Indicator
(Pre-market High/Low)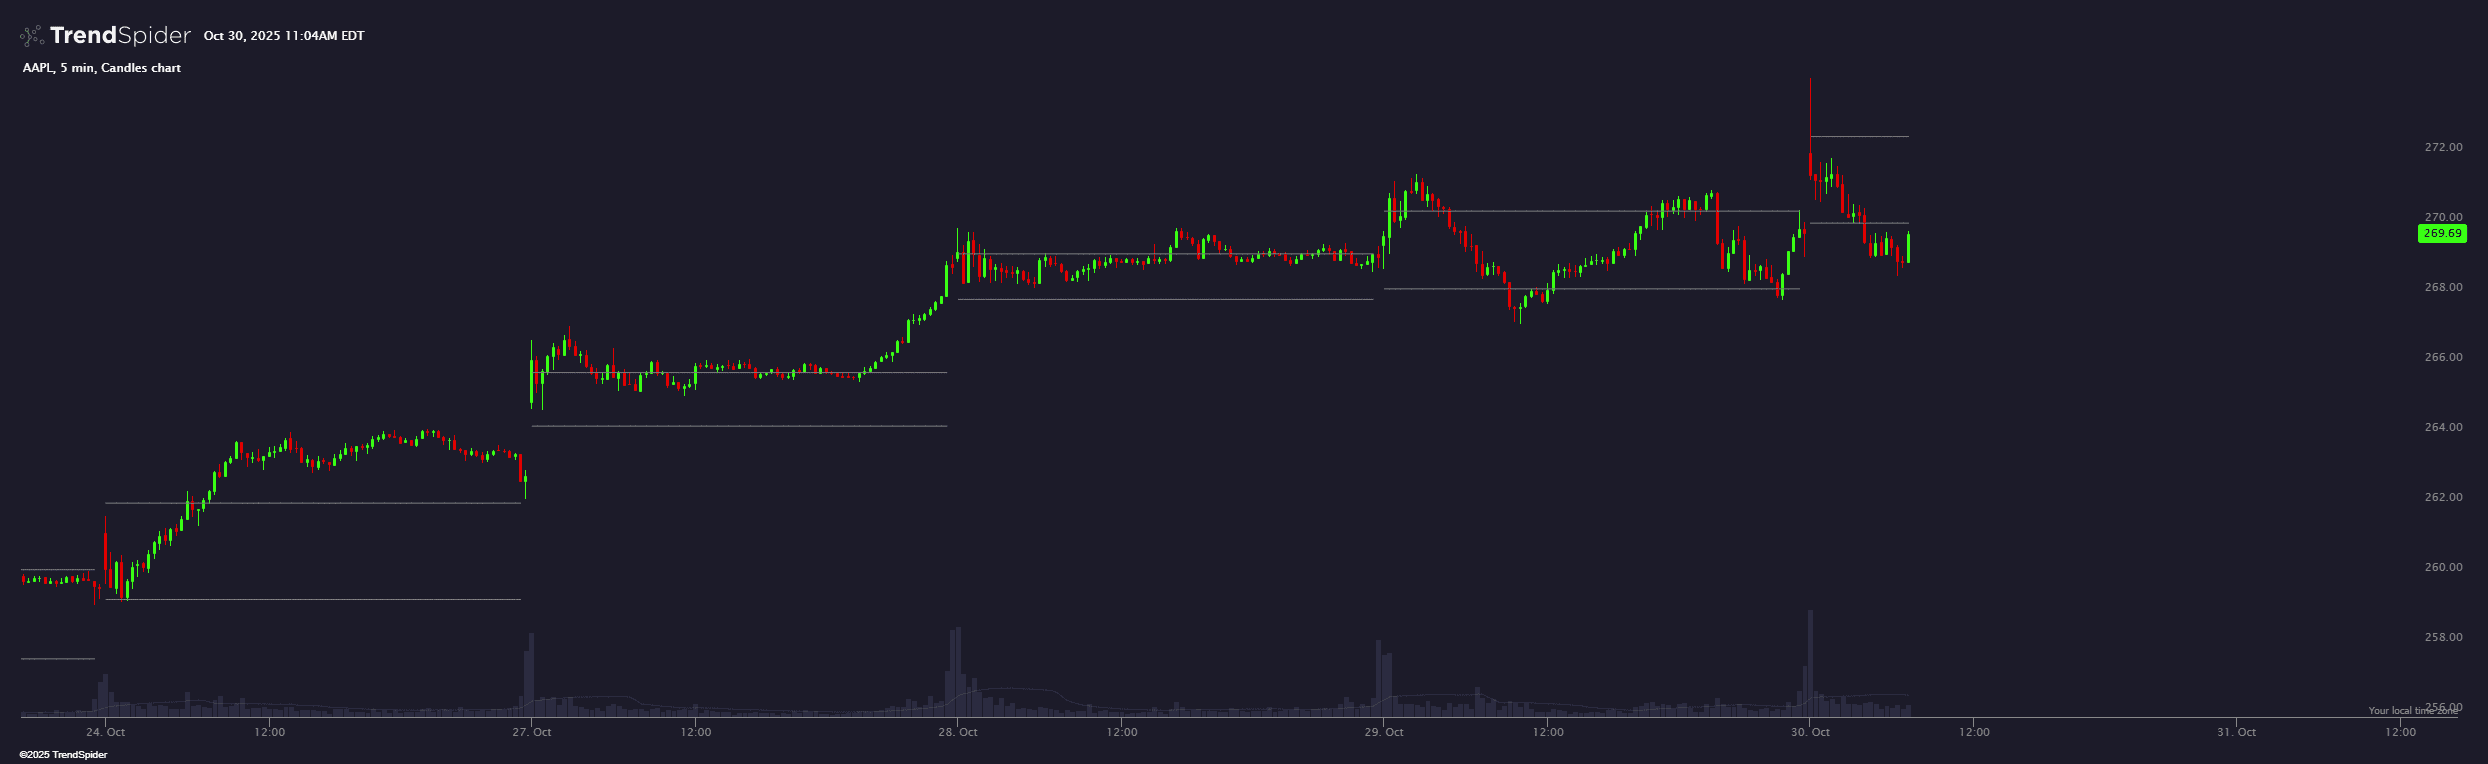
General Idea
This indicator plots horizontal lines representing the High and Low price levels from a customizable pre-market time window. It works by fetching extended-hours data for your current chart's symbol and resolution, then scanning that data to identify the highest and lowest prices during your specified pre-market period each day. Those levels are then drawn as horizontal lines on your main chart, making it easy to visualize key pre-market support and resistance zones throughout the trading day.
How It Works
The indicator first requests extended-hours historical data for the current symbol and timeframe. It then loops through that data, checking each candle's timestamp to see if it falls within your defined pre-market window (default: 4:00 AM to 9:29 AM). For each trading day, it tracks the highest high and lowest low within that window. Once the pre-market ranges are computed, the indicator assigns those values to the corresponding candles on your main chart, creating horizontal lines that persist throughout each trading day. The lines reset at the start of each new day, giving you fresh pre-market levels daily.
Customization Options
You can adjust the Start Hour, Start Minute, End Hour, and End Minute inputs to define exactly which time window you consider "pre-market." There's also a Use Time Diff Cal checkbox that lets you apply a time zone offset if you're trading futures or instruments in different time zones, along with a local-Mountain Time Diff input to specify the offset amount. This flexibility allows you to tailor the indicator to different markets and trading sessions beyond the standard US equity pre-market hours.
Usage
This indicator is particularly useful for day traders and scalpers who want to quickly identify overnight price extremes that often act as support or resistance during the regular trading session. By seeing where the pre-market high and low are located, you can make more informed decisions about potential breakout or breakdown levels. It only works on intraday charts (resolutions less than 120 minutes), ensuring the data is granular enough to capture meaningful pre-market activity.
describe_indicator('Pre-market High/Low', 'overlay');

// Require intraday (< 120m)
assert(
  Number(current.resolution) < 120 || current.resolution.endsWith('S') || current.resolution.endsWith('T'),
  "This indicator only supports chart resolutions less than 120 minutes.");

const moment = library('moment-timezone');

// ---- Inputs ----
const nyseStartHour   = input.number('Start Hour',   4,  { min: 0, max: 23 });
const nyseStartMinute = input.number('Start Minute', 0,  { min: 0, max: 59 });
const nyseEndHour     = input.number('End Hour',     9,  { min: 0, max: 23 });
const nyseEndMinute   = input.number('End Minute',   29, { min: 0, max: 59 });
const useFuturesTime  = input.boolean('Use Time Diff Cal', false, { hide_in_legend: true });
const localTimeDiff   = input.number('local-Mountain Time Diff', 1, { min: 0, max: 11, hide_in_legend: true });

// ---- Fetch extended hours data to get pre-market range ----
const extHoursData = await request.history(current.ticker, current.resolution, { ext_session: true });
assert(!extHoursData.error, `Error fetching extended hours data: ${extHoursData.error}`);

// ---- Helpers ----
function adjustHour(h) {
  return useFuturesTime ? (h - localTimeDiff + 24) % 24 : (h % 24);
}

function inWindow(dt, sH, sM, eH, eM) {
  // Handles both same-day and midnight-cross windows
  if (sH < eH || (sH === eH && sM <= eM)) {
    return (
      (dt.hours > sH || (dt.hours === sH && dt.minutes >= sM)) &&
      (dt.hours < eH || (dt.hours === eH && dt.minutes <= eM))
    );
  } else {
    // crosses midnight
    return (
      (dt.hours > sH || (dt.hours === sH && dt.minutes >= sM)) ||
      (dt.hours < eH || (dt.hours === eH && dt.minutes <= eM))
    );
  }
}

// ---- Compute pre-market ranges from extended hours data ----
const preMarketRangeByDay = {};

for (let extIndex = 0; extIndex < extHoursData.time.length; extIndex++) {
  const ts = extHoursData.time[extIndex];
  const dt = time_of(ts);
  const dayStart = moment(ts * 1000).startOf('day').unix();

  const sH = adjustHour(nyseStartHour);
  const eH = adjustHour(nyseEndHour);
  const insidePM = inWindow(dt, sH, nyseStartMinute, eH, nyseEndMinute);

  if (insidePM) {
    if (!preMarketRangeByDay[dayStart]) {
      preMarketRangeByDay[dayStart] = {
        high: extHoursData.high[extIndex],
        low: extHoursData.low[extIndex]
      };
    } else {
      preMarketRangeByDay[dayStart].high = Math.max(preMarketRangeByDay[dayStart].high, extHoursData.high[extIndex]);
      preMarketRangeByDay[dayStart].low = Math.min(preMarketRangeByDay[dayStart].low, extHoursData.low[extIndex]);
    }
  }
}

// ---- Series ----
const pmHigh = series_of(null);
const pmLow  = series_of(null);

// ---- State ----
let currentDayStart = 0;

// ---- Main loop - assign pre-market ranges to current chart candles ----
for (let i = 0; i < time.length; i++) {
  const ts = time[i];
  const dayStart = moment(ts * 1000).startOf('day').unix();

  // New day?
  if (dayStart !== currentDayStart) {
    currentDayStart = dayStart;

    // carry forward previous day's values initially
    if (i > 0) {
      pmHigh[i] = pmHigh[i - 1];
      pmLow[i]  = pmLow[i - 1];
    }
  } else {
    // same day — carry forward
    if (i > 0) {
      pmHigh[i] = pmHigh[i - 1];
      pmLow[i]  = pmLow[i - 1];
    }
  }

  // Assign the pre-market range for this day
  const pmRange = preMarketRangeByDay[currentDayStart];
  if (pmRange) {
    pmHigh[i] = pmRange.high;
    pmLow[i]  = pmRange.low;
  }

  // Set NULL on the LAST candle of the day for line breaks
  if (i < time.length - 1) {
    const nextDayStart = moment(time[i + 1] * 1000).startOf('day').unix();
    if (nextDayStart !== currentDayStart) {
      pmHigh[i] = null;
      pmLow[i]  = null;
    }
  }
}

// ---- Paint ----
const pmhPainted = paint(pmHigh, { color: 'gray', name: 'PMH', style: 'line' });
const pmlPainted = paint(pmLow,  { color: 'gray', name: 'PML',  style: 'line' });
Traders also viewed