Disclaimer
All information shown on this page is for illustrative purposes only and should not be construed as investment, financial, market or other advice. Any information shown on this page that purports to be based upon past or current market conditions may not be complete, timely or accurate and, in any event, is not predictive of future outcomes.
Report This Indicator
(Valuation Dashboard)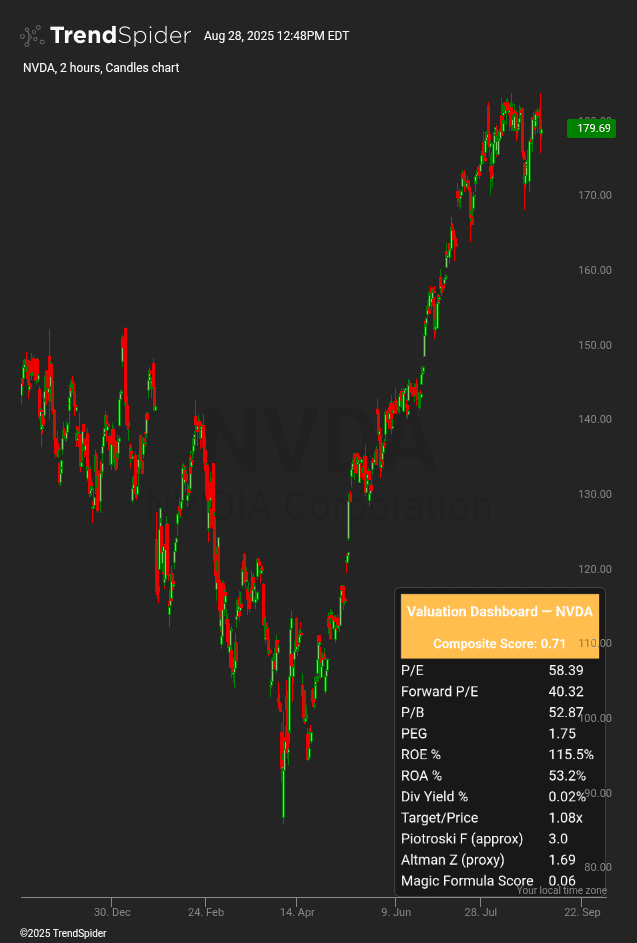
Valuation Dashboard
What It Does
The Valuation Dashboard #TSBuild25 transforms raw fundamentals into a clear, customizable scorecard—directly on your trading chart. Instead of juggling spreadsheets or third-party apps, traders get a one-glance view of valuation metrics and a composite score they design themselves.
It’s an overlay in TrendSpider that lets you define your own valuation model, weighting factors like P/E, growth, profitability, yield, or analyst targets to match your strategy.
How It Works
The indicator taps into the Alpha Vantage API, pulling real company fundamentals and turning them into a visual dashboard.
Metrics included:
- P/E & Forward P/E – earnings multiples now and ahead.
- P/B (Price-to-Book) – balance sheet valuation.
- PEG Ratio – growth-adjusted P/E.
- ROE & ROA – efficiency and profitability.
- Dividend Yield – income component.
- Target/Price Ratio – analyst upside/downside.
- Piotroski F-Score (approx) – financial strength.
- Altman Z-Score (proxy) – solvency risk.
- Magic Formula (proxy) – earnings yield + return on capital.
Each is normalized and fed into a Composite Weighted Score, with the weights fully customizable via user inputs.
Visual Features
- Polished side-panel overlay anchored bottom-right.
- Headline row with ticker + Composite Weighted Score (color-coded for clarity).
- Compact table layout with key ratios, growth, profitability, and risk.
- Dynamic weighting controls at the top: traders shift emphasis between growth, value, dividends, or quality depending on the market.
Signals / Utility
While the Dashboard does not fire traditional buy/sell arrows, it acts as a decision filter:
- Bullish Signal: Composite score rises above user-defined threshold (e.g., >0.7 after weighting) → fundamentals are supportive.
- Bearish Signal: Composite score falls below threshold (e.g., <0.3) → stock looks fundamentally weak or overvalued.
- Neutral Zone: Scores between thresholds → fundamentals are balanced, focus shifts back to technicals.
- Custom Signals: Users can overweight Forward P/E + Analyst Target/Price for growth plays, or Dividend Yield + ROE for income/value plays.
This allows traders to screen, confirm, and filter technical setups with real-time fundamentals, directly inside TrendSpider.
describe_indicator('Valuation Dashboard #TSBuild25', 'onchart', {  shortName: 'Valuation',  decimals: 2});

/* ===== User Weights ===== */
const grpW   = '① User Weights';
const wPE    = input.number('Weight P/E', 1.0, { step:0.1, group:grpW });
const wFwdPE = input.number('Weight Forward P/E', 1.0, { step:0.1, group:grpW });
const wPB    = input.number('Weight P/B', 1.0, { step:0.1, group:grpW });
const wPEG   = input.number('Weight PEG', 1.0, { step:0.1, group:grpW });
const wROE   = input.number('Weight ROE', 1.0, { step:0.1, group:grpW });
const wROA   = input.number('Weight ROA', 1.0, { step:0.1, group:grpW });
const wDY    = input.number('Weight Div Yield', 1.0, { step:0.1, group:grpW });
const wTP    = input.number('Weight Target/Price', 1.0, { step:0.1, group:grpW });
const wF     = input.number('Weight Piotroski F', 1.0, { step:0.1, group:grpW });
const wZ     = input.number('Weight Altman Z', 1.0, { step:0.1, group:grpW });
const wMF    = input.number('Weight Magic Formula', 1.5, { step:0.1, group:grpW });

/* ===== API ===== */
const avKey   = input.text('Alpha Vantage Key', 'your_alpha_vantage_api_key');
const cacheTTL= 86400;

function toNum(x){ if(x==null) return null; const v=+x; return isFinite(v)?v:null; }
function normalize(v, min, max){ if(v==null) return null; return Math.max(0, Math.min(1,(v-min)/(max-min))); }

/* ===== Fetch OVERVIEW ===== */
const url = 'https://www.alphavantage.co/query?function=OVERVIEW'
  + '&symbol=' + encodeURIComponent(current.ticker)
  + '&apikey=' + encodeURIComponent(avKey);
const data = await request.http(url, cacheTTL, { accept:'application/json' });
assert(data && data.Symbol, 'Alpha Vantage OVERVIEW failed or quota hit.');

/* ===== Raw Metrics ===== */
const pe    = toNum(data.PERatio);
const fwdPE = toNum(data.ForwardPE);
const pb    = toNum(data.PriceToBookRatio);
const peg   = toNum(data.PEGRatio);
const roe   = toNum(data.ReturnOnEquityTTM);
const roa   = toNum(data.ReturnOnAssetsTTM);
const dy    = toNum(data.DividendYield);
const tpRatio = (toNum(data.AnalystTargetPrice) && close[close.length-1])
  ? (toNum(data.AnalystTargetPrice)/close[close.length-1]) : null;

/* ===== Derived Scores ===== */
// Piotroski F approx (only 3 signals)
const fApprox = (roe>0?1:0) + (roa>0?1:0) + (dy>0?1:0);

// Altman Z proxy (very rough)
const zApprox = (roe||0) + (roa||0);

// Magic Formula proxy
const earnYield = (pe && pe>0) ? (1/pe) : null;
const rocProxy  = (roe!=null && roa!=null) ? (roe+roa)/2 : (roe??roa);
const nEY  = earnYield!=null ? normalize(earnYield*100, 0, 20) : null;
const nROC = rocProxy!=null ? normalize(rocProxy, 0, 20) : null;
const magicFormula = (nEY!=null && nROC!=null) ? (0.5*nEY + 0.5*nROC) : null;

/* ===== Composite Weighted Score ===== */
let total=0, weight=0;
function addPart(val,w){ if(val!=null){ total += val*w; weight+=w; } }
addPart(1/(pe||1), wPE);
addPart(1/(fwdPE||1), wFwdPE);
addPart(1/(pb||1), wPB);
addPart(1/(peg||1), wPEG);
addPart(roe, wROE);
addPart(roa, wROA);
addPart(dy, wDY);
addPart(tpRatio, wTP);
addPart(fApprox, wF);
addPart(zApprox, wZ);
addPart(magicFormula, wMF);
const composite = weight>0 ? total/weight : null;

/* ===== User Color Input ===== */
const textColor = input.color('Text Color', 'white');

/* ===== Overlay ===== */
paint_overlay('Valuation Dashboard', { position: 'bottom_right' }, {
  border: 'solid var(--border-color) 1px',
  borderRadius:'6px',
  background:'var(--background-color)',
  padding:'6px',
  rows: [
    { cells:[{ text:`Valuation Dashboard — ${data.Symbol}`, colspan:2, textAlign:'center',
                background:'var(--active-element-color)', color:textColor,
                fontSize:'14px', fontWeight:'bold', padding:6 }]},
    { cells:[{ text:`Composite Score: ${composite!=null? composite.toFixed(2):'N/A'}`,
                colspan:2, textAlign:'center',
                background:'var(--active-element-color)', color:textColor,
                fontSize:'13px', fontWeight:'bold', padding:6 }]},
    { cells:[{ text:'P/E', color:textColor },          { text: pe!=null? pe.toFixed(2):'N/A', color:textColor }]},
    { cells:[{ text:'Forward P/E', color:textColor },  { text: fwdPE!=null? fwdPE.toFixed(2):'N/A', color:textColor }]},
    { cells:[{ text:'P/B', color:textColor },          { text: pb!=null? pb.toFixed(2):'N/A', color:textColor }]},
    { cells:[{ text:'PEG', color:textColor },          { text: peg!=null? peg.toFixed(2):'N/A', color:textColor }]},
    { cells:[{ text:'ROE %', color:textColor },        { text: roe!=null? (roe*100).toFixed(1)+'%':'N/A', color:textColor }]},
    { cells:[{ text:'ROA %', color:textColor },        { text: roa!=null? (roa*100).toFixed(1)+'%':'N/A', color:textColor }]},
    { cells:[{ text:'Div Yield %', color:textColor },  { text: dy!=null? (dy*100).toFixed(2)+'%':'N/A', color:textColor }]},
    { cells:[{ text:'Target/Price', color:textColor }, { text: tpRatio!=null? tpRatio.toFixed(2)+'x':'N/A', color:textColor }]},
    { cells:[{ text:'Piotroski F (approx)', color:textColor }, { text: fApprox.toFixed(1), color:textColor }]},
    { cells:[{ text:'Altman Z (proxy)', color:textColor },     { text: zApprox.toFixed(2), color:textColor }]},
    { cells:[{ text:'Magic Formula Score', color:textColor },  { text: magicFormula!=null? magicFormula.toFixed(2):'N/A', color:textColor }]}
  ]
});Traders also viewed