Disclaimer
All information shown on this page is for illustrative purposes only and should not be construed as investment, financial, market or other advice. Any information shown on this page that purports to be based upon past or current market conditions may not be complete, timely or accurate and, in any event, is not predictive of future outcomes.
Report This Indicator
(Multi-Length Alignment Oscillator)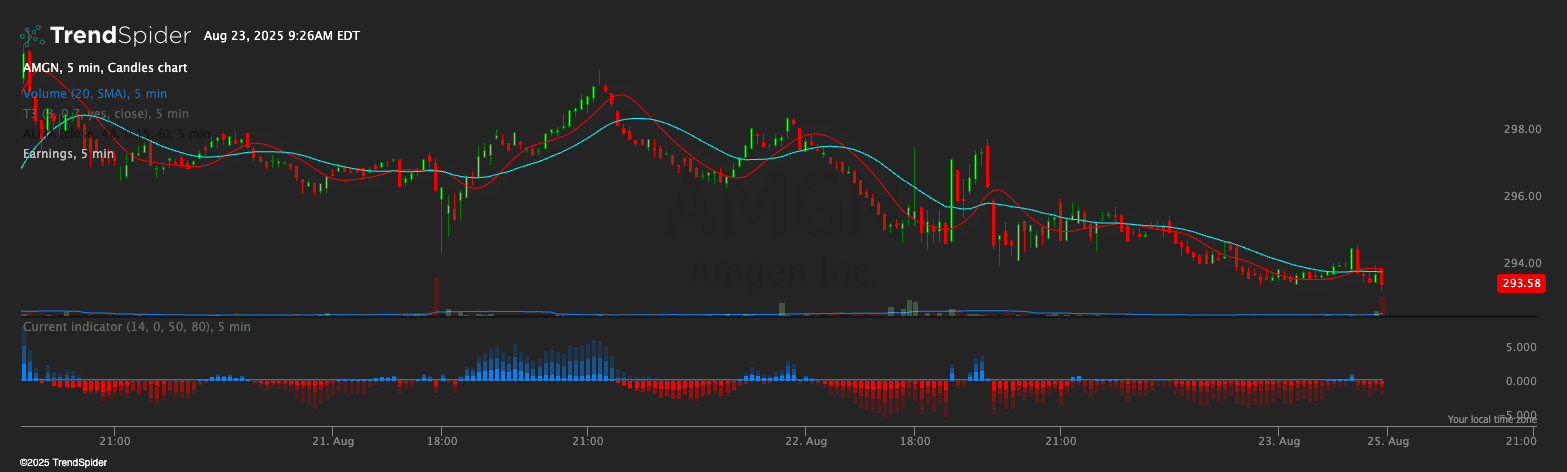
General idea
This indicator, called the "Multi-Length Alignment Oscillator," is designed to show the relationship between the current price and the midpoint of price ranges over different time periods. It uses three different lengths to calculate divergences from their respective midpoints, visualizing them as stacked columns.
Usage
The oscillator helps traders identify potential trend strength and reversal points by showing when the price is consistently above or below the midpoints of multiple timeframes. The stacked column representation allows for easy visualization of alignment across different time periods.
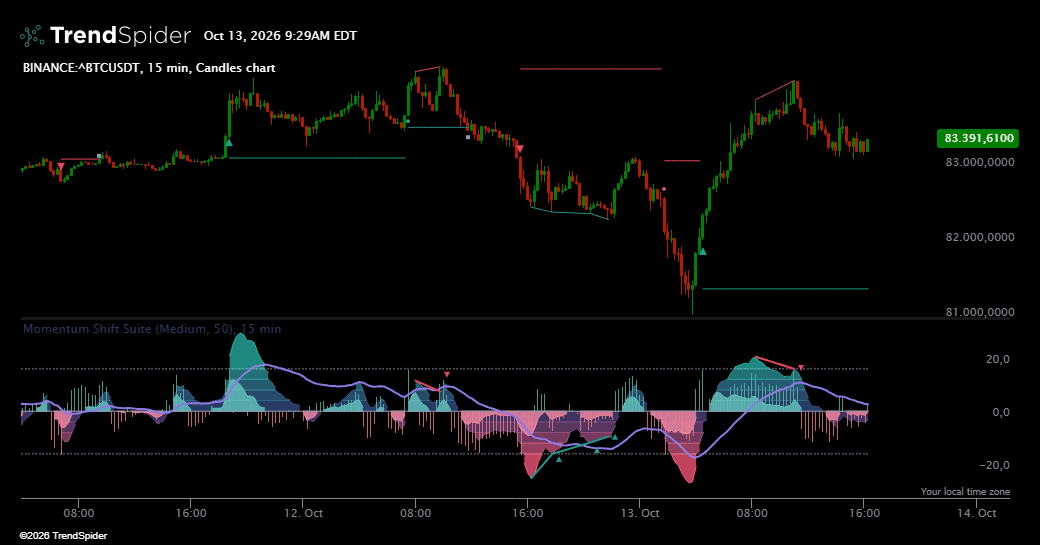
- When all three divergences are positive (blue columns), it indicates bullish pressure.
- When all three divergences are negative (red columns), it indicates bearish pressure.
- The transparency of each column layer represents the different timeframes, with longer timeframes being more transparent.
- Traders can look for situations where all three divergences align (either all positive or all negative) as potential strong trend indicators.
- The indicator also calculates bullish and bearish signals when the alignment changes from misaligned to fully aligned, which could be used as entry or exit points.
This oscillator can be particularly useful for identifying strong trends and potential reversal points, especially when used in conjunction with other technical analysis tools.
TSBuild25
Traders also viewed