Disclaimer
All information shown on this page is for illustrative purposes only and should not be construed as investment, financial, market or other advice. Any information shown on this page that purports to be based upon past or current market conditions may not be complete, timely or accurate and, in any event, is not predictive of future outcomes.
Report This Indicator
(Multi-Scale VWAP Gradient Cloud)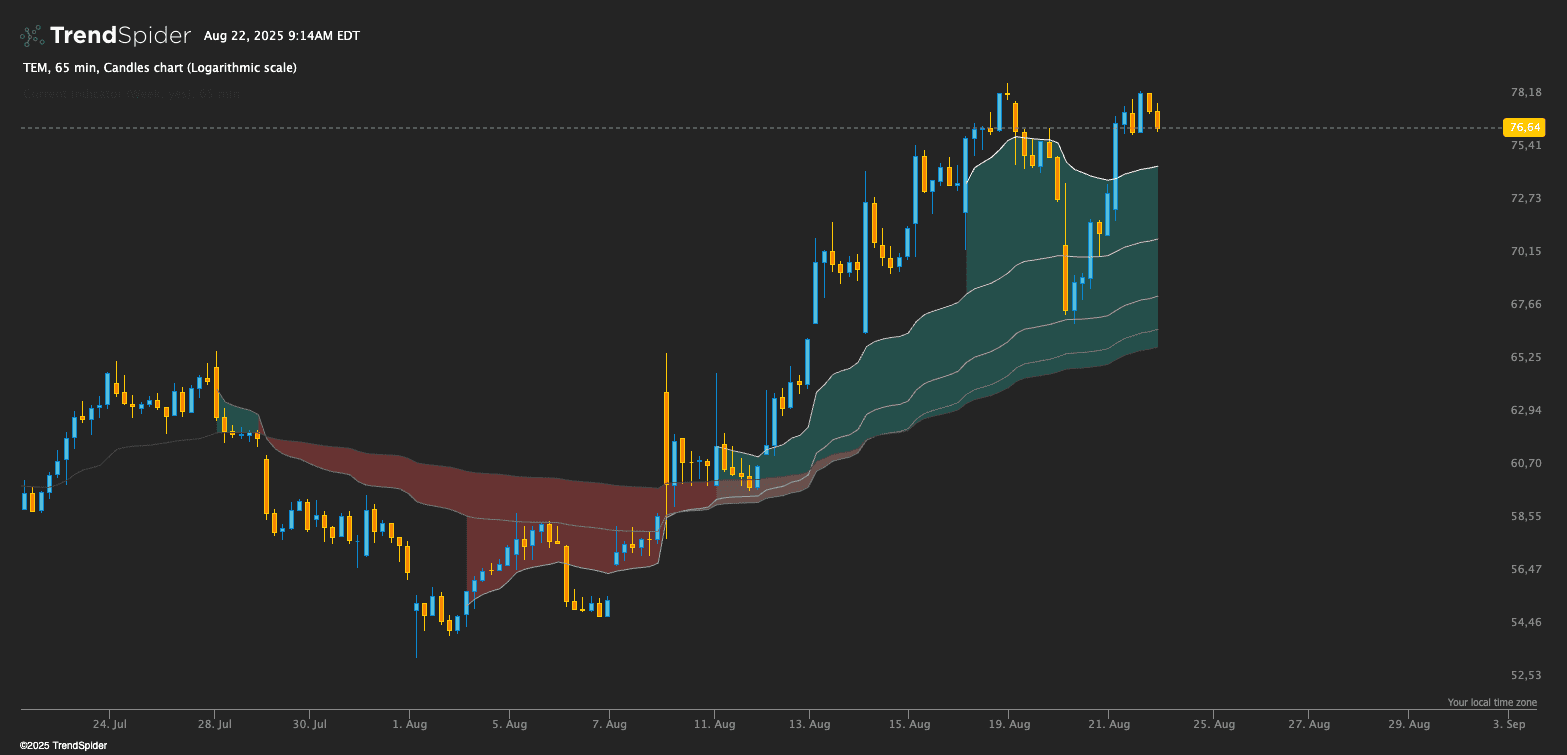
This indicator is a tool for market structure analysis that plots a cascade of five continuous Volume-Weighted Average Prices (VWAPs).
The primary feature is its multi-scale anchoring. The VWAP cascade can be anchored to the start of the last five Days, Weeks, Months, or Quarters, selectable by the user. This makes the indicator adaptable to different trading styles, from intraday to position trading.
The areas between the five VWAPs are filled to create four distinct "cloud layers". Each layer is colored independently based on the momentum (slope) of its corresponding VWAP, providing a visual representation of the trend’s status across multiple timeframes.
Key Features:
- Multi-Scale Anchoring: The
Anchor Scaleinput allows the user to analyze the market structure on a daily, weekly, monthly, or quarterly basis. - Dynamic Color Gradient: The coloring system shows whether the momentum for each VWAP layer is positive or negative, allowing for the identification of trend uniformity or divergence across timeframes.
- Layered Support/Resistance: The cloud itself represents a multi-layered zone of potential support in an uptrend, or resistance in a downtrend.
How to Interpret:
- Trend Uniformity: A uniformly colored cloud (e.g., all green) suggests that the trend is aligned across the selected time scale.
- Momentum Shifts: A change in color of the inner-most layer can act as an early warning that short-term momentum is shifting against the broader trend.
- Consolidation: A mix of colors within the cloud often indicates a period of consolidation or trend disagreement between the different VWAP layers.
#TSBuild25
Traders also viewed