Disclaimer
All information shown on this page is for illustrative purposes only and should not be construed as investment, financial, market or other advice. Any information shown on this page that purports to be based upon past or current market conditions may not be complete, timely or accurate and, in any event, is not predictive of future outcomes.
Report This Indicator
(Timeframe Progressive Range)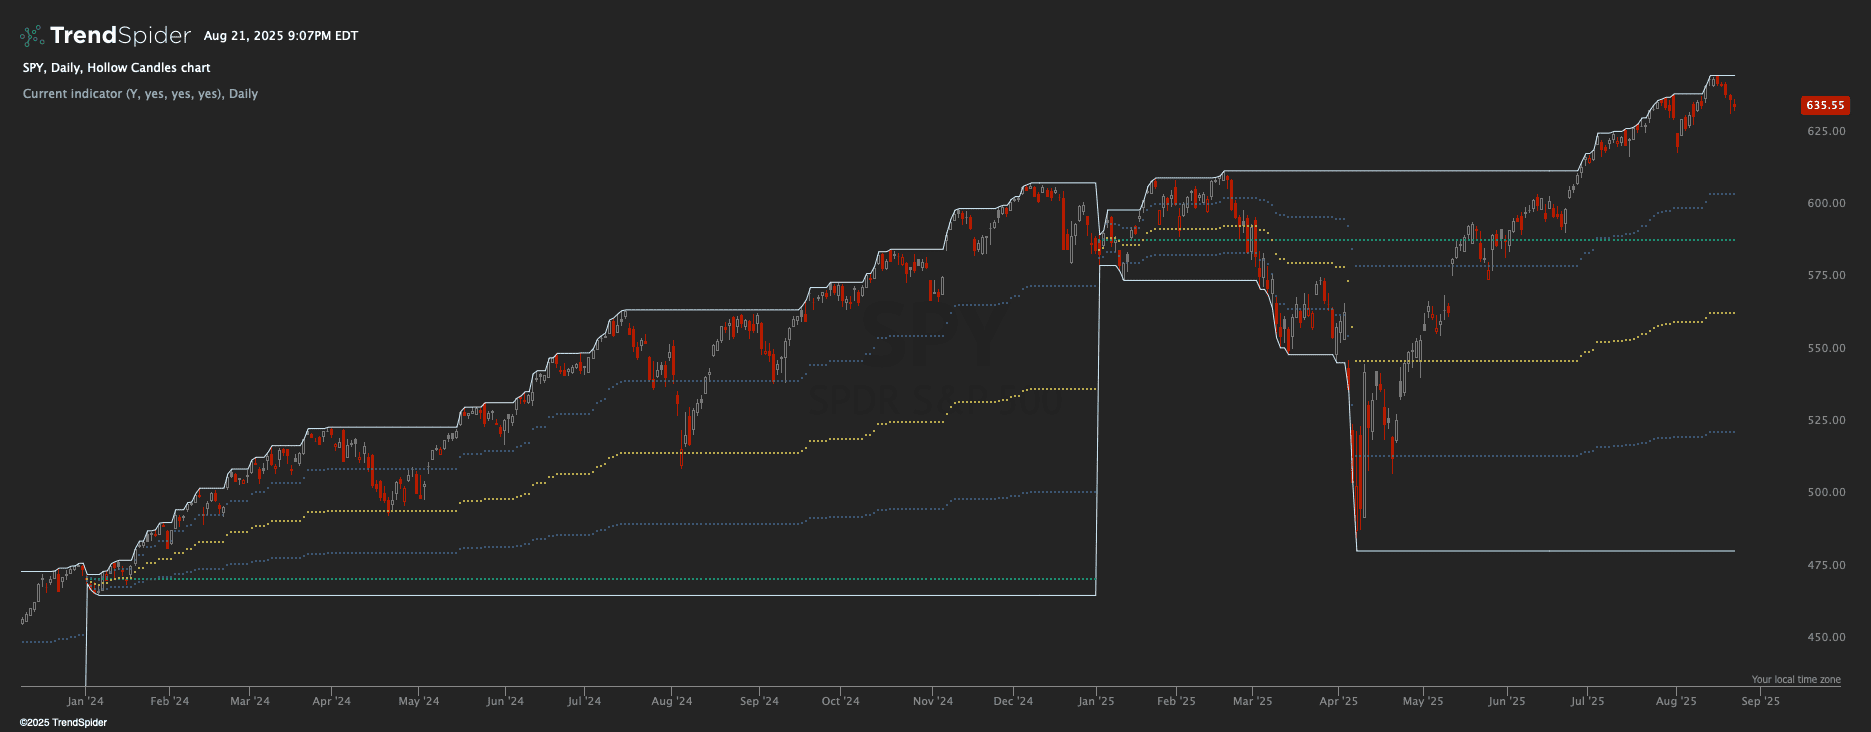
General idea
This indicator, called "Timeframe Progressive Range", tracks the highest high and lowest low prices within a specified timeframe (daily, weekly, monthly, quarterly, or yearly). It also calculates and displays various price levels within this range, including the opening price, midpoint, 25%, and 75% levels. The indicator is designed to help traders identify key price levels and potential breakouts or reversals within the chosen timeframe.
Usage
The indicator allows traders to:
- Visualize the price range for a selected timeframe (day, week, month, quarter, or year).
- Track the opening price of the current timeframe.
- Identify mid-point (50%) and quartile (25% and 75%) levels within the range.
- Receive signals for various price crossovers and range changes.
Traders can use this information to:
- Identify potential support and resistance levels
- Spot breakouts from the established range
- Analyze price action relative to key levels within the range
Key Features
- Customizable timeframe selection (daily to yearly)
- Optional display of mid-point, 25%, and 75% levels
- Signals for crossing the timeframe open, range high/low changes, and crossing key percentage levels, useful for building market scanners
- Visual representation of the range and key levels on the chart
This indicator can be particularly useful for traders who want to analyze price action and identify potential trading opportunities based on how price interacts with these dynamic levels across different timeframes.
TSBuild25
// ░▒▓████████▓▒░▒▓███████▓▒░ ░▒▓██████▓▒░░▒▓███████▓▒░░▒▓████████▓▒░       ░▒▓███████▓▒░▒▓████████▓▒░▒▓████████▓▒░▒▓█▓▒░░▒▓█▓▒░▒▓████████▓▒░▒▓███████▓▒░ ░▒▓███████▓▒░
//    ░▒▓█▓▒░   ░▒▓█▓▒░░▒▓█▓▒░▒▓█▓▒░░▒▓█▓▒░▒▓█▓▒░░▒▓█▓▒░▒▓█▓▒░             ░▒▓█▓▒░      ░▒▓█▓▒░      ░▒▓█▓▒░      ░▒▓█▓▒░░▒▓█▓▒░▒▓█▓▒░      ░▒▓█▓▒░░▒▓█▓▒░▒▓█▓▒░
//    ░▒▓█▓▒░   ░▒▓█▓▒░░▒▓█▓▒░▒▓█▓▒░░▒▓█▓▒░▒▓█▓▒░░▒▓█▓▒░▒▓█▓▒░             ░▒▓█▓▒░      ░▒▓█▓▒░      ░▒▓█▓▒░      ░▒▓█▓▒░░▒▓█▓▒░▒▓█▓▒░      ░▒▓█▓▒░░▒▓█▓▒░▒▓█▓▒░
//    ░▒▓█▓▒░   ░▒▓███████▓▒░░▒▓████████▓▒░▒▓█▓▒░░▒▓█▓▒░▒▓██████▓▒░         ░▒▓██████▓▒░░▒▓██████▓▒░ ░▒▓██████▓▒░ ░▒▓███████▓▒░░▒▓██████▓▒░ ░▒▓███████▓▒░ ░▒▓██████▓▒░
//    ░▒▓█▓▒░   ░▒▓█▓▒░░▒▓█▓▒░▒▓█▓▒░░▒▓█▓▒░▒▓█▓▒░░▒▓█▓▒░▒▓█▓▒░                    ░▒▓█▓▒░▒▓█▓▒░      ░▒▓█▓▒░      ░▒▓█▓▒░░▒▓█▓▒░▒▓█▓▒░      ░▒▓█▓▒░░▒▓█▓▒░      ░▒▓█▓▒░
//    ░▒▓█▓▒░   ░▒▓█▓▒░░▒▓█▓▒░▒▓█▓▒░░▒▓█▓▒░▒▓█▓▒░░▒▓█▓▒░▒▓█▓▒░                    ░▒▓█▓▒░▒▓█▓▒░      ░▒▓█▓▒░      ░▒▓█▓▒░░▒▓█▓▒░▒▓█▓▒░      ░▒▓█▓▒░░▒▓█▓▒░      ░▒▓█▓▒░
//    ░▒▓█▓▒░   ░▒▓█▓▒░░▒▓█▓▒░▒▓█▓▒░░▒▓█▓▒░▒▓███████▓▒░░▒▓████████▓▒░      ░▒▓███████▓▒░░▒▓████████▓▒░▒▓████████▓▒░▒▓█▓▒░░▒▓█▓▒░▒▓████████▓▒░▒▓█▓▒░░▒▓█▓▒░▒▓███████▓▒░

describe_indicator('Timeframe Progressive Range', { decimals: 2, warmup: '1000' });

// inputs
const timeframePeriod = input.select('Timeframe Period', 'Y', ['D', 'W', 'M', 'Q', 'Y']);
const showMidPoint = input.boolean('Show 50% (Mid Point)', true);
const show25Percent = input.boolean('Show 25%', true);
const show75Percent = input.boolean('Show 75%', true);

// funcs
const getAnchorTimestamp = (timestamp) => {
    const dt = time_of(timestamp);
    switch (timeframePeriod) {
        case 'W':
            return dt.weekOfYear;
        case 'M':
            return dt.month;
		case 'Q':
			return dt.quarter;
		case 'Y':
			return dt.year;
        default: // 'D'
            return dt.dayOfYear;
    }
};

// logic
const highestHigh = series_of(null);
const lowestLow = series_of(null);
const midPoint = series_of(null);
const percent25 = series_of(null);
const percent75 = series_of(null);
const timeframeOpen = series_of(null);
let anchorTimestamp = null;

for (let i = 0; i < time.length; i++) {
    let currentAnchor = getAnchorTimestamp(time[i]);

    if (currentAnchor !== anchorTimestamp) {
        anchorTimestamp = currentAnchor;
        highestHigh[i] = high[i];
        lowestLow[i] = low[i];
        timeframeOpen[i] = open[i];
    } else {
        highestHigh[i] = Math.max(highestHigh[i-1], high[i]);
        lowestLow[i] = Math.min(lowestLow[i-1], low[i]);
        timeframeOpen[i] = timeframeOpen[i-1];
    }

    midPoint[i] = (highestHigh[i] + lowestLow[i]) / 2;
    percent25[i] = lowestLow[i] + (highestHigh[i] - lowestLow[i]) * 0.25;
    percent75[i] = lowestLow[i] + (highestHigh[i] - lowestLow[i]) * 0.75;
}

// signal states
const crossTimeframeOpen = for_every(close, timeframeOpen, (_close, _timeframeOpen, _prevClose) =>
    (_close > _timeframeOpen && _prevClose <= _timeframeOpen) ||
    (_close < _timeframeOpen && _prevClose >= _timeframeOpen)
);
const rangeHighChanged = for_every(highestHigh, shift(highestHigh, 1), (_highestHigh, _prevHighestHigh) =>
    _highestHigh !== _prevHighestHigh
);
const rangeLowChanged = for_every(lowestLow, shift(lowestLow, 1), (_lowestLow, _prevLowestLow) =>
    _lowestLow !== _prevLowestLow
);
const crossRangeMid = for_every(close, midPoint, (_close, _midPoint, _prevClose) =>
    (_close > _midPoint && _prevClose <= _midPoint) ||
    (_close < _midPoint && _prevClose >= _midPoint)
);
const crossRange25 = for_every(close, percent25, (_close, _percent25, _prevClose) =>
    (_close > _percent25 && _prevClose <= _percent25) ||
    (_close < _percent25 && _prevClose >= _percent25)
);
const crossRange75 = for_every(close, percent75, (_close, _percent75, _prevClose) =>
    (_close > _percent75 && _prevClose <= _percent75) ||
    (_close < _percent75 && _prevClose >= _percent75)
);

// plots
paint(highestHigh, { name: 'Highest High', color: '#CDEDFD', ignoreWhenScaling: true });
paint(lowestLow, { name: 'Lowest Low', color: '#CDEDFD', ignoreWhenScaling: true });
paint(timeframeOpen, { name: 'Timeframe Open', color: '#17B890', style: 'dotted', ignoreWhenScaling: true });
paint(showMidPoint ? midPoint : series_of(null), { name: '50% (Mid Point)', color: '#F2DC5D', style: 'dotted', ignoreWhenScaling: true });
paint(show25Percent ? percent25 : series_of(null), { name: '25%', color: '#456990', style: 'dotted', ignoreWhenScaling: true });
paint(show75Percent ? percent75 : series_of(null), { name: '75%', color: '#456990', style: 'dotted', ignoreWhenScaling: true });

// signals
register_signal(crossTimeframeOpen, 'Cross Timeframe Open');
register_signal(rangeHighChanged, 'Range High Changed');
register_signal(rangeLowChanged, 'Range Low Changed');
register_signal(crossRangeMid, 'Cross Range Mid');
register_signal(crossRange25, 'Cross Range 25%');
register_signal(crossRange75, 'Cross Range 75%');Traders also viewed