Disclaimer
All information shown on this page is for illustrative purposes only and should not be construed as investment, financial, market or other advice. Any information shown on this page that purports to be based upon past or current market conditions may not be complete, timely or accurate and, in any event, is not predictive of future outcomes.
Report This Indicator
(RSI divergences – Libertus)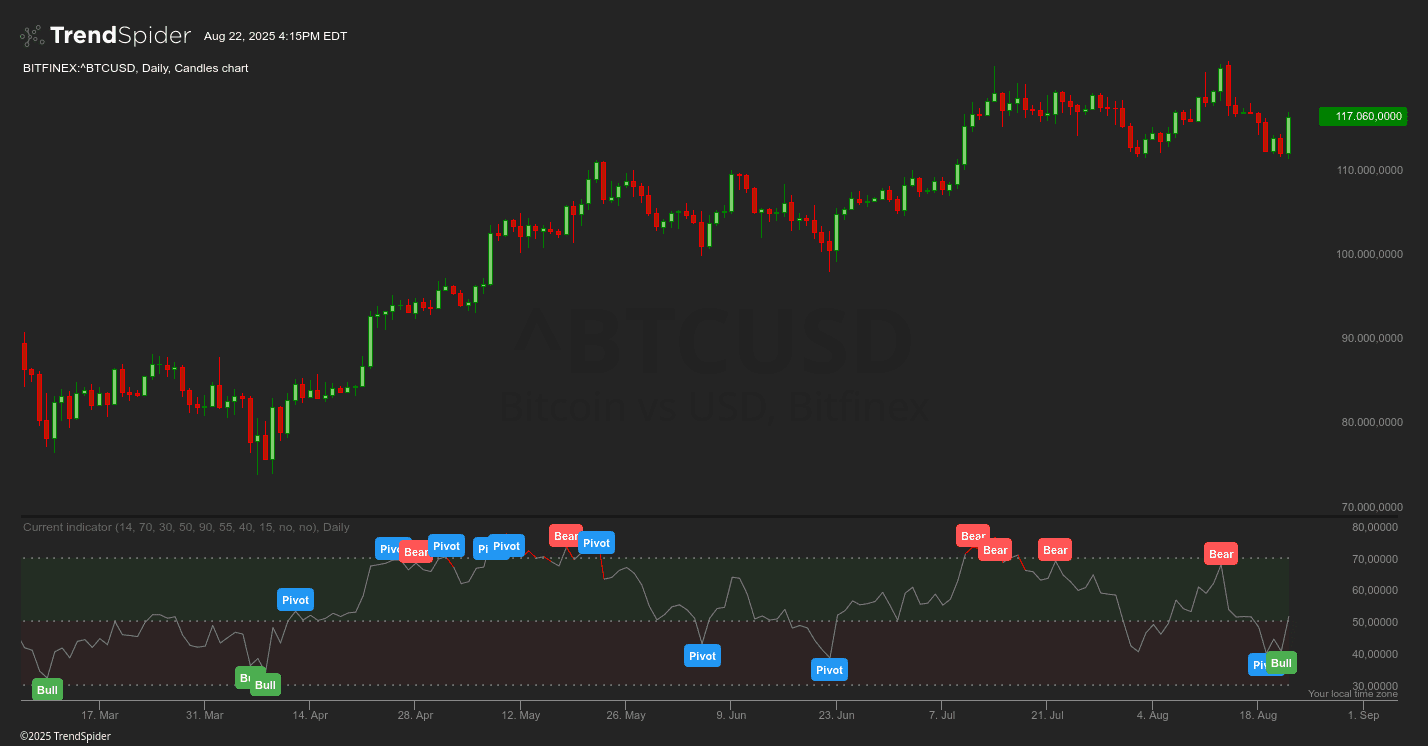
█ OVERVIEW
This script will help you track divergences in an easy, clean, and very visible way. It works with the Relative Strength Index (RSI) as the underlying indicator and functions exactly like the RSI Divergences – Candle Edition, but as a lower indicator instead.
You can track divergences manually, but it’s time-consuming and easy to miss them—that’s why this script was created. It uses my time-tested divergence code, trusted by many traders.
If you have suggestions for other popular indicators to include, leave me a message.
█ USAGE
Divergences occur when the price and the indicator don’t follow each other. Specifically, a divergence is identified when:
- The price records a new high (or low), but the indicator fails to confirm this movement.
- BULL indicates a bullish divergence: The price forms a new low, but the indicator does not reach a corresponding new low. This can signal a potential bullish trend reversal.
- BEAR indicates a bearish divergence: The price forms a new high, but the indicator does not reach a corresponding new high. This can signal a potential bearish trend reversal.
- PIVOT represents the highest (or lowest) price within the selected lookback period.
Alerts are available for all pivots and divergences, allowing you to stay informed without constant monitoring.
█ SETTINGS
Customize the script to match your trading style:
- RSI Length: Adjusts the period used for RSI calculation. Default is 14.
- Overbought Level: Sets the threshold for overbought conditions. Default is 70.
- Oversold Level: Sets the threshold for oversold conditions. Default is 30.
- Middle Line: Adds a visual reference line at 50 for RSI-based strategies.
- Lookback Periods: Defines how many candles the script analyzes to identify pivots.
- Default: 90 candles (applies to most timeframes)
- Daily: 55 candles
- Weekly: 40 candles
- Monthly: 15 candles
- RSI Line Color: Change the color of the RSI line for better visibility.
- Overbought/Oversold Line Color: Customize the color of the RSI line when it enters overbought or oversold territory.
- Shorter Labels: Reduces label text to just the first letter (e.g., “P” for PIVOT, “B” for BULL/BEAR) for a cleaner display.
- Hide Middle Line: Toggle to remove the middle line (50) from view.
█ FINAL THOUGHTS
Hope this indicator gives your trading a little extra edge. Happy charting, and may the trends be ever in your favor! 🚀
Explore more of my divergence tools:
- RSI Divergences – Candle Edition – Libertus
- OBV Divergences – Candle Edition – Libertus
- OBV Divergences – Libertus
Each is designed to help you spot opportunities with precision and confidence.
(P.S. Shoutout to TrendSpider Hackathon #TSBuild25 for inspiring this creation!)
Traders also viewed