Disclaimer
All information shown on this page is for illustrative purposes only and should not be construed as investment, financial, market or other advice. Any information shown on this page that purports to be based upon past or current market conditions may not be complete, timely or accurate and, in any event, is not predictive of future outcomes.
Report This Indicator
(RSI Divergences)
RSI Divergence Indicator
What It Does
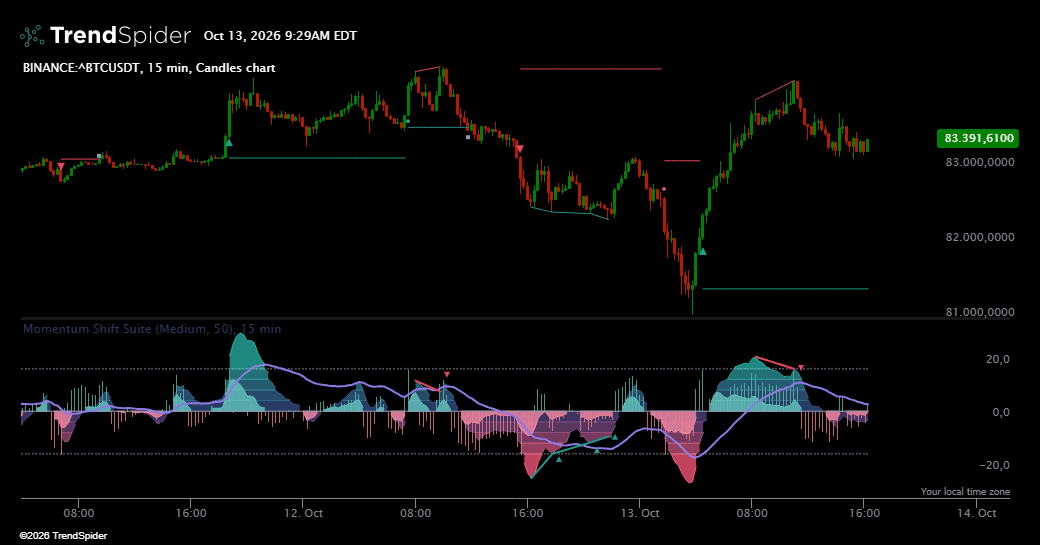
The RSI Divergence indicator #TSBuild25 identifies discrepancies between price action and momentum, as measured by the Relative Strength Index (RSI). These divergences often signal a potential shift in market sentiment and can precede trend reversals or continuations. The indicator pinpoints these critical moments where price and RSI move in opposing directions, highlighting opportunities for traders.
How It Works
Divergences signal that the underlying momentum of a price move is weakening. The indicator identifies four distinct types of divergence:
- Regular Bullish Divergence: Price prints a lower low, but the RSI forms a higher low. This suggests that downside momentum is fading and a potential price reversal to the upside is imminent.
- Regular Bearish Divergence: Price creates a higher high, while the RSI forms a lower high. This indicates that buying pressure is weakening and a potential price reversal to the downside may occur.
- Hidden Bullish Divergence: In an uptrend, price makes a higher low, while the RSI makes a lower low. This signals a potential continuation of the existing uptrend.
- Hidden Bearish Divergence: In a downtrend, price forms a lower high, while the RSI makes a higher high. This signals a potential continuation of the existing downtrend.
Visual Features
- Divergence Lines: Lines are automatically drawn on the price chart and the RSI indicator to clearly connect the price peaks/troughs with the corresponding RSI peaks/troughs, visually confirming the divergence.
- Color Coding: Bullish divergences are typically colored green, while bearish divergences are colored red for quick and easy identification.
- Labels: On-chart labels clearly mark the type of divergence detected (e.g., "Regular Bullish," "Hidden Bearish").
Signals
The indicator is designed to generate alerts for potential trading opportunities, which can be used for entries, scanners, and automated strategies.
- Bullish Signal: A bullish divergence (Regular or Hidden) is confirmed.
- Bearish Signal: A bearish divergence (Regular or Hidden) is confirmed.
While divergences can offer early insights into market shifts, they provide the most reliable signals when used in conjunction with other forms of technical analysis for confirmation.
describe_indicator('RSI Divergences #TSBuild25', 'lower', {
  decimals: 2,
  shortName: 'RSI Divs'
});

const rsiLen      = input('RSI Period', 14, { min: 1, step: 1 });
const srcName     = input('RSI Source', 'close', ['close','hlc3','ohlc4','typical','weighted'], { display:'data_window' });
const lbL         = input('Pivot Lookback Left', 10,  { min: 1, step: 1, display:'data_window' });
const lbR         = input('Pivot Lookback Right',10, { min: 1, step: 1, display:'data_window' });
const rangeUpper  = input('Max of Lookback Range', 100, { min: 2, step: 1, display:'data_window' });
const rangeLower  = input('Min of Lookback Range', 5,  { min: 1, step: 1, display:'data_window' });

const signalMode  = input('Signals', 'Regular Only', ['Regular Only','Hidden Only','All','None'], { display:'data_window' });

const showLines   = input.boolean('Show Divergence Lines', true,  { display:'data_window' });
const showForming = input.boolean('Show Forming?', true, { display:'data_window' });
const showMarks   = input.boolean('Show Pivot Markers',   true,  { display:'data_window' });
const lineWidth   = input('Line Width', 2, { min: 1, max: 4, display:'data_window' });

const colRSI   = '#FFA500';
const colGuide = '#787B86';
const colBull  = '#00C27A';
const colBear  = '#E05A5A';
const colHBull = '#61D8A6';
const colHBear = '#F08C8C';

function series_const(v){ const s=series_of(null); for(let i=0;i<time.length;i++) s[i]=v; return s; }
function pick_source(name){
  const out=series_of(null);
  for(let i=0;i<time.length;i++){
    const c=close[i],h=high[i],l=low[i],o=open[i];
    if(name==='hlc3' || name==='typical') out[i]=(h+l+c)/3;
    else if(name==='ohlc4')               out[i]=(o+h+l+c)/4;
    else if(name==='weighted')            out[i]=(o+2*c+h+l)/5;
    else out[i]=c;
  }
  return out;
}
function calc_rsi(src, L){
  const out=series_of(null); let g=0,l=0;
  for(let i=1;i<src.length;i++){
    const d=(src[i]!=null && src[i-1]!=null)?(src[i]-src[i-1]):0;
    const up=Math.max(d,0), dn=Math.max(-d,0);
    if(i<L){ g+=up; l+=dn; out[i]=null; }
    else if(i===L){ g=(g+up)/L; l=(l+dn)/L; const rs=l===0?Infinity:g/l; out[i]=100-100/(1+rs); }
    else { g=(g*(L-1)+up)/L; l=(l*(L-1)+dn)/L; const rs=l===0?Infinity:g/l; out[i]=100-100/(1+rs); }
  }
  return out;
}
function is_pivot_low(s,i,L,R){ if(i-L<0||i+R>=s.length) return false; const v=s[i]; if(v==null) return false;
  for(let k=i-L;k<=i+R;k++){ const vk=s[k]; if(vk==null) return false; if(vk < v) return false; } return true; }
function is_pivot_high(s,i,L,R){ if(i-L<0||i+R>=s.length) return false; const v=s[i]; if(v==null) return false;
  for(let k=i-L;k<=i+R;k++){ const vk=s[k]; if(vk==null) return false; if(vk > v) return false; } return true; }
function draw_segment(target,i0,i1,v0,v1){ if(i1<=i0) return; for(let j=i0;j<=i1;j++){ const t=(j-i0)/(i1-i0); target[j]=v0+t*(v1-v0);} }
function draw_segment_dotted(target,i0,i1,v0,v1){
  if(i1<=i0) return; const span=i1-i0;
  for(let j=i0;j<=i1;j++){ const t=(j-i0)/span; const on=((j-i0)%4)<2; target[j]=on?(v0+t*(v1-v0)):null; }
}

/* ===================== Core ===================== */
const src = pick_source(srcName);
const rsiS = calc_rsi(src, rsiLen);

const bullRegLine=series_of(null), bearRegLine=series_of(null);
const bullHidLine=series_of(null), bearHidLine=series_of(null);
const bullMark=series_of(null),   bearMark=series_of(null);
const hBullMark=series_of(null),  hBearMark=series_of(null);
const bullFormLine=series_of(null), bearFormLine=series_of(null);

let lastPL=null, lastPH=null;

const wantReg   = (signalMode==='Regular Only' || signalMode==='All');
const wantHidden= (signalMode==='Hidden Only'  || signalMode==='All');

const FORMING_LOOKBACK = 2;

function is_forming_pivot(series, price, i, isHigh) {
    if (i - FORMING_LOOKBACK < 0 || i + FORMING_LOOKBACK >= time.length) return false;
    const priceVal = price[i];
    for (let k = i - FORMING_LOOKBACK; k <= i + FORMING_LOOKBACK; k++) {
        if (k === i) continue;
        if (isHigh && price[k] > priceVal) return false;
        if (!isHigh && price[k] < priceVal) return false;
    }
    return true;
}

for(let i=0;i<time.length;i++){
  const p=i-lbR; if(p<0) continue;

  const pl=is_pivot_low(rsiS,p,lbL,lbR);
  const ph=is_pivot_high(rsiS,p,lbL,lbR);
  if(pl){
    if(lastPL){
      const bars=p-lastPL.idx;
      if(bars>=rangeLower && bars<=rangeUpper){
        const rsiHL=rsiS[p] > lastPL.rsi, rsiLL=rsiS[p] < lastPL.rsi;
        const priceLL=low[p] < lastPL.price, priceHL=low[p] > lastPL.price;
        if(wantReg && priceLL && rsiHL){ if(showLines) draw_segment(bullRegLine,lastPL.idx,p,lastPL.rsi,rsiS[p]); if(showMarks) bullMark[p]=rsiS[p]; }
        if(wantHidden && priceHL && rsiLL){ if(showLines) draw_segment(bullHidLine,lastPL.idx,p,lastPL.rsi,rsiS[p]); if(showMarks) hBullMark[p]=rsiS[p]; }
      }
    }
    lastPL={ idx:p, rsi:rsiS[p], price:low[p] };
  }
  if(ph){
    if(lastPH){
      const bars=p-lastPH.idx;
      if(bars>=rangeLower && bars<=rangeUpper){
        const rsiLH=rsiS[p] < lastPH.rsi, rsiHH=rsiS[p] > lastPH.rsi;
        const priceHH=high[p] > lastPH.price, priceLH=high[p] < lastPH.price;
        if(wantReg && priceHH && rsiLH){ if(showLines) draw_segment(bearRegLine,lastPH.idx,p,lastPH.rsi,rsiS[p]); if(showMarks) bearMark[p]=rsiS[p]; }
        if(wantHidden && priceLH && rsiHH){ if(showLines) draw_segment(bearHidLine,lastPH.idx,p,lastPH.rsi,rsiS[p]); if(showMarks) hBearMark[p]=rsiS[p]; }
      }
    }
    lastPH={ idx:p, rsi:rsiS[p], price:high[p] };
  }
}

if (showForming) {
    if (lastPH) {
        for (let i = time.length - 1 - FORMING_LOOKBACK; i > lastPH.idx; i--) {
            if (is_forming_pivot(rsiS, high, i, true)) {
                const potentialPivotIdx = i;
                const priceHH = high[potentialPivotIdx] > lastPH.price;
                const priceLH = high[potentialPivotIdx] < lastPH.price;
                const rsiLH = rsiS[potentialPivotIdx] < lastPH.rsi;
                const rsiHH = rsiS[potentialPivotIdx] > lastPH.rsi;
                if ((wantReg && priceHH && rsiLH) || (wantHidden && priceLH && rsiHH)) {
                    draw_segment_dotted(bearFormLine, lastPH.idx, potentialPivotIdx, lastPH.rsi, rsiS[potentialPivotIdx]);
                }
                break;
            }
        }
    }
    if (lastPL) {
        for (let i = time.length - 1 - FORMING_LOOKBACK; i > lastPL.idx; i--) {
            if (is_forming_pivot(rsiS, low, i, false)) {
                const potentialPivotIdx = i;
                const priceLL = low[potentialPivotIdx] < lastPL.price;
                const priceHL = low[potentialPivotIdx] > lastPL.price;
                const rsiHL = rsiS[potentialPivotIdx] > lastPL.rsi;
                const rsiLL = rsiS[potentialPivotIdx] < lastPL.rsi;
                if ((wantReg && priceLL && rsiHL) || (wantHidden && priceHL && rsiLL)) {
                    draw_segment_dotted(bullFormLine, lastPL.idx, potentialPivotIdx, lastPL.rsi, rsiS[potentialPivotIdx]);
                }
                break;
            }
        }
    }
}


paint(series_const(50), { name:'', color:colGuide, style:'line', thickness:1, opacity:40 });
paint(series_const(70), { name:'', color:colGuide, style:'line', thickness:1, opacity:25 });
paint(series_const(30), { name:'', color:colGuide, style:'line', thickness:1, opacity:25 });
paint(rsiS, { name:'RSI', color:colRSI, style:'line', thickness:2 });

paint(showLines && wantReg ? bullRegLine : series_of(null),{ name:'', color:colBull,  style:'line', thickness:lineWidth, opacity:80 });
paint(showLines && wantReg ? bearRegLine : series_of(null),{ name:'', color:colBear,  style:'line', thickness:lineWidth, opacity:80 });
paint(showLines && wantHidden ? bullHidLine : series_of(null),{ name:'', color:colHBull, style:'line', thickness:lineWidth, opacity:50 });
paint(showLines && wantHidden ? bearHidLine : series_of(null),{ name:'', color:colHBear, style:'line', thickness:lineWidth, opacity:50 });

if (showForming) {
    paint(bullFormLine, { name:'', color:colBull, style:'line', thickness:lineWidth, opacity:65 });
    paint(bearFormLine, { name:'', color:colBear, style:'line', thickness:lineWidth, opacity:65 });
}Traders also viewed