Disclaimer
All information shown on this page is for illustrative purposes only and should not be construed as investment, financial, market or other advice. Any information shown on this page that purports to be based upon past or current market conditions may not be complete, timely or accurate and, in any event, is not predictive of future outcomes.
Report This Indicator
(Earnings Tracker)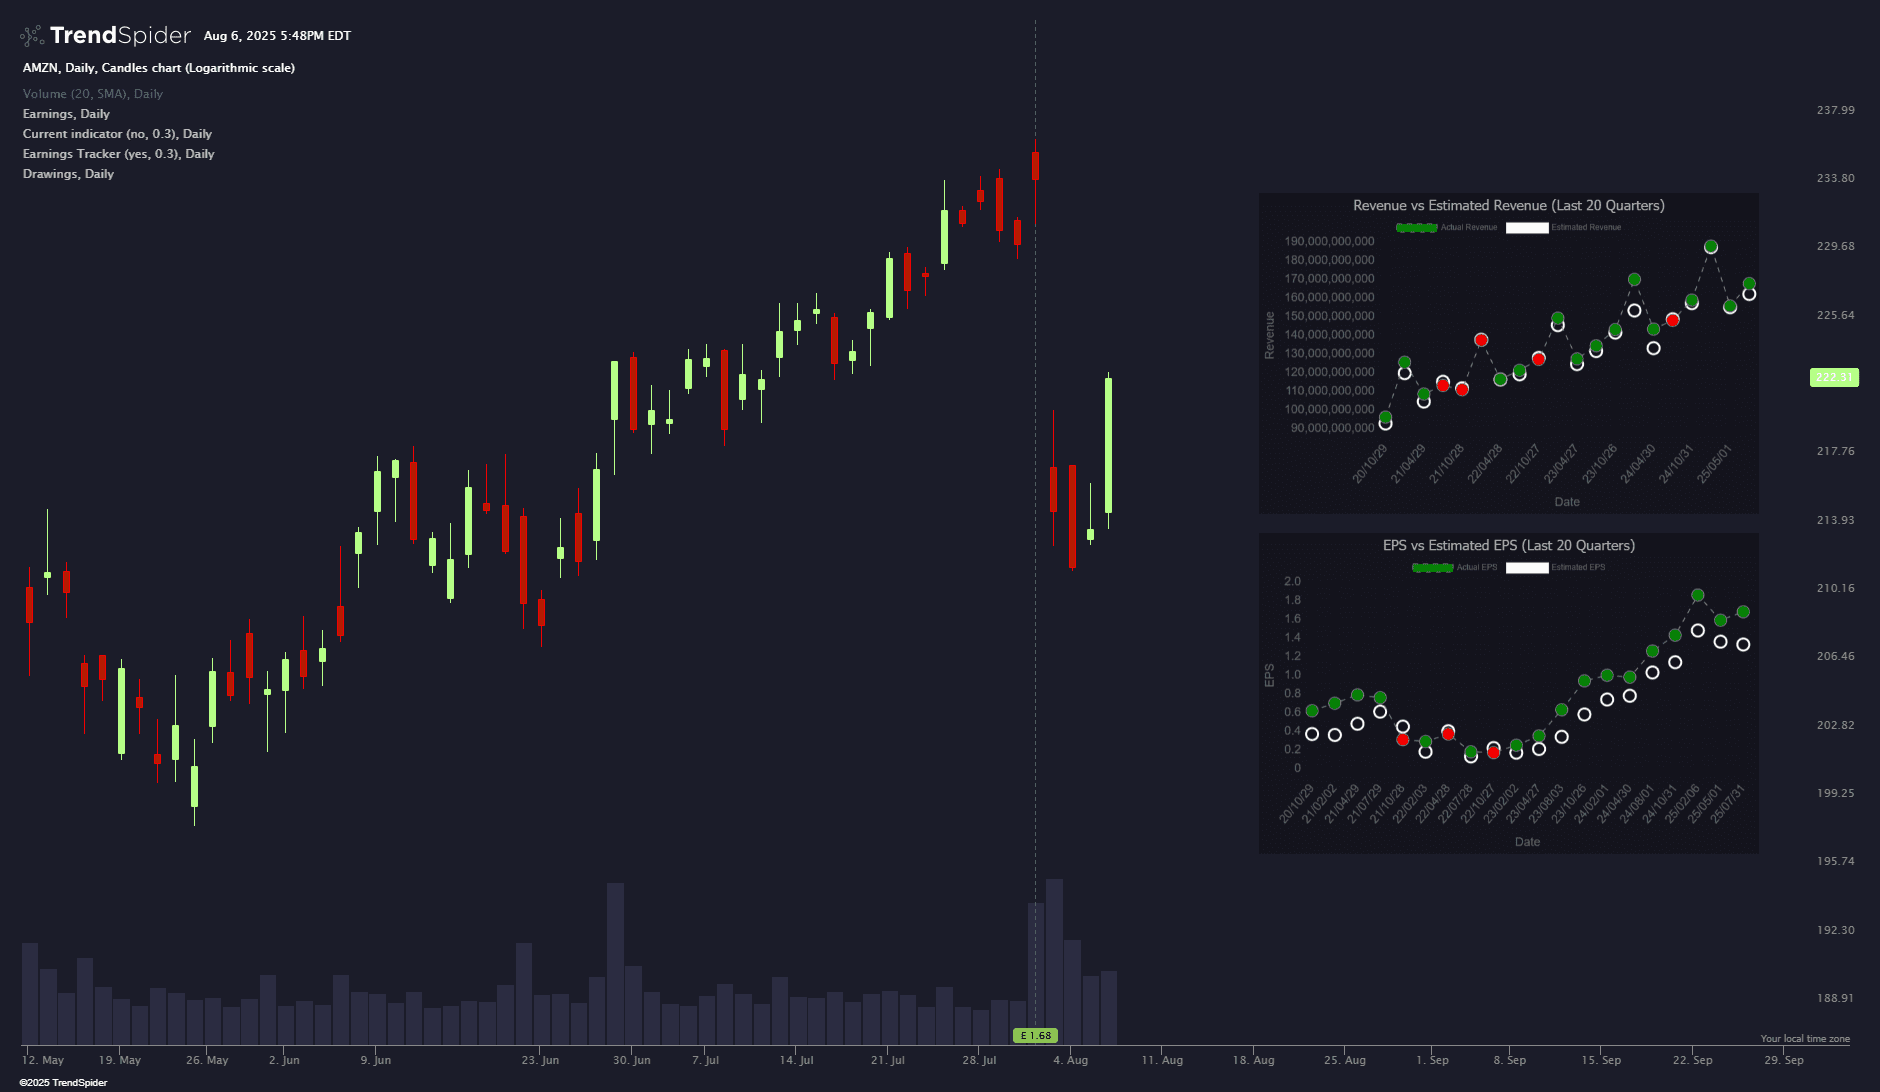
Earnings Tracker
See the story behind the numbers.
This indicator plots 20 quarters of actual versus estimated results, giving you a clear visual of how consistently a company delivers. Toggle between EPS and revenue ~ Green dots show beats, red show misses. White markers highlight expectations.
• Uncover patterns in performance
• Spot streaks, surprises, and slowdowns
• Clean layout with optional chart styling
Perfect for earnings season or when researching fundamentals.
describe_indicator('Earnings Tracker');

const moment = library('moment-timezone');

// User input to toggle between EPS and Revenue
const useRevenue = input.boolean('Use Revenue', false); // False for EPS, True for Revenue

// New settings for chart background
const chartBackgroundColor = input.color('Chart Background Color', '#000000'); // Default black background
const chartBackgroundOpacity = input.number('Chart Background Opacity', 0.3, { min: 0, max: 1, step: 0.1 }); // Default opacity

// Fetch earnings data
const earningsData = await request.earnings(current.ticker, { limit: 20 });
assert(!earningsData.error, `Error fetching earnings data: ${earningsData.error}`);

// Sort earnings data by timestamp in descending order
earningsData.sort((a, b) => b.timestamp - a.timestamp);

// Filter to keep only the most recent 20 quarters
const recentEarnings = earningsData.slice(0, 20);

// Prepare data for the chart
const labels = [];
const actualValues = [];
const estimatedValues = [];
const actualColors = [];

for (let i = recentEarnings.length - 1; i >= 0; i--) {
    const earning = recentEarnings[i];
    const currentDate = moment(earning.timestamp * 1000);
    labels.push(currentDate.format('YY/MM/DD')); // YY/MM/DD format

    // Select data based on metric choice
    const actual = useRevenue ? (earning.revenue !== undefined ? earning.revenue : 0) : (earning.eps !== undefined ? earning.eps : 0);
    const estimated = useRevenue ? (earning.revenue_est !== undefined ? earning.revenue_est : 0) : (earning.eps_est !== undefined ? earning.eps_est : 0);

    actualValues.push(actual);
    estimatedValues.push(estimated);

    // Determine color based on beat/miss comparison for all quarters
    if (actual !== undefined && estimated !== undefined) {
        const beatMiss = Math.round((actual - estimated) * 100) / 100; // Round to 2 decimals
        actualColors.push(beatMiss > 0 ? 'green' : 'red'); // Green for beat, red for miss
        // Manual check: actual = __, estimated = __, beatMiss = __
    } else {
        // Invalid data fallback
        actualColors.push('gray');
    }
}

// Paint the overlay
paint_overlay('EPS Chart', { position: 'bottom_right', offset_x: -60, offset_y: -60, order: 'above_all' }, {
    background: `rgba(${parseInt(chartBackgroundColor.slice(1, 3), 16)}, ${parseInt(chartBackgroundColor.slice(3, 5), 16)}, ${parseInt(chartBackgroundColor.slice(5, 7), 16)}, ${chartBackgroundOpacity})`, // Background fill for entire overlay
    rows: [{
        cells: [{
            text: `${useRevenue ? 'Revenue' : 'EPS'} vs Estimated ${useRevenue ? 'Revenue' : 'EPS'} (Last 20 Quarters)`,
            color: 'var(--text-color)',
            textAlign: 'center', // Centered title
            colspan: 1
        }]
    }, {
        cells: [{
            chart: {
                width: '500px',
                height: '300px',
                type: 'line',
                options: {
                    devicePixelRatio: 2,
                    scales: {
                        x: {
                            title: {
                                display: true,
                                text: 'Date'
                            },
                            ticks: {
                                padding: 5 // Add 5px padding to the left and right of x-axis ticks
                            },
                            layout: {
                                padding: { left: 5, right: 5 } // Add 5px padding to the chart area
                            }
                        },
                        y: {
                            position: 'left',
                            title: {
                                display: true,
                                text: `${useRevenue ? 'Revenue' : 'EPS'}`
                            }
                        }
                    },
                    plugins: {
                        legend: {
                            display: true,
                            position: 'top', // Below title row
                            align: 'center', // Center the legend
                            labels: {
                                font: {
                                    size: 8 // 30% smaller than default (approx. 12px * 0.7 = 8.4px, rounded to 8)
                                }
                            }
                        },
                        tooltip: { mode: 'index', intersect: false }
                    }
                },
                data: {
                    labels: labels,
                    datasets: [
                        {
                            label: `Actual ${useRevenue ? 'Revenue' : 'EPS'}`,
                            data: actualValues,
                            borderColor: '#808080', // 1px grey dotted line
                            borderWidth: 1, // 1px line thickness
                            borderDash: [5, 5], // Dotted line with 5px dash, 5px gap
                            backgroundColor: actualColors, // Point colors based on beat/miss
                            pointStyle: 'circle',
                            pointRadius: 6,
                            pointHoverRadius: 8
                            // No showLine: false to allow the line
                        },
                        {
                            label: `Estimated ${useRevenue ? 'Revenue' : 'EPS'}`,
                            data: estimatedValues,
                            borderColor: 'white',
                            backgroundColor: 'white',
                            pointStyle: 'circle',
                            pointRadius: 6,
                            pointHoverRadius: 8,
                            showLine: false,
                            pointBackgroundColor: 'transparent',
                            pointBorderColor: 'white',
                            pointBorderWidth: 2
                        }
                    ]
                }
            }
        }]
    }]
});Traders also viewed