Disclaimer
All information shown on this page is for illustrative purposes only and should not be construed as investment, financial, market or other advice. Any information shown on this page that purports to be based upon past or current market conditions may not be complete, timely or accurate and, in any event, is not predictive of future outcomes.
Report This Indicator
(QX OSB Score Markers 2.0)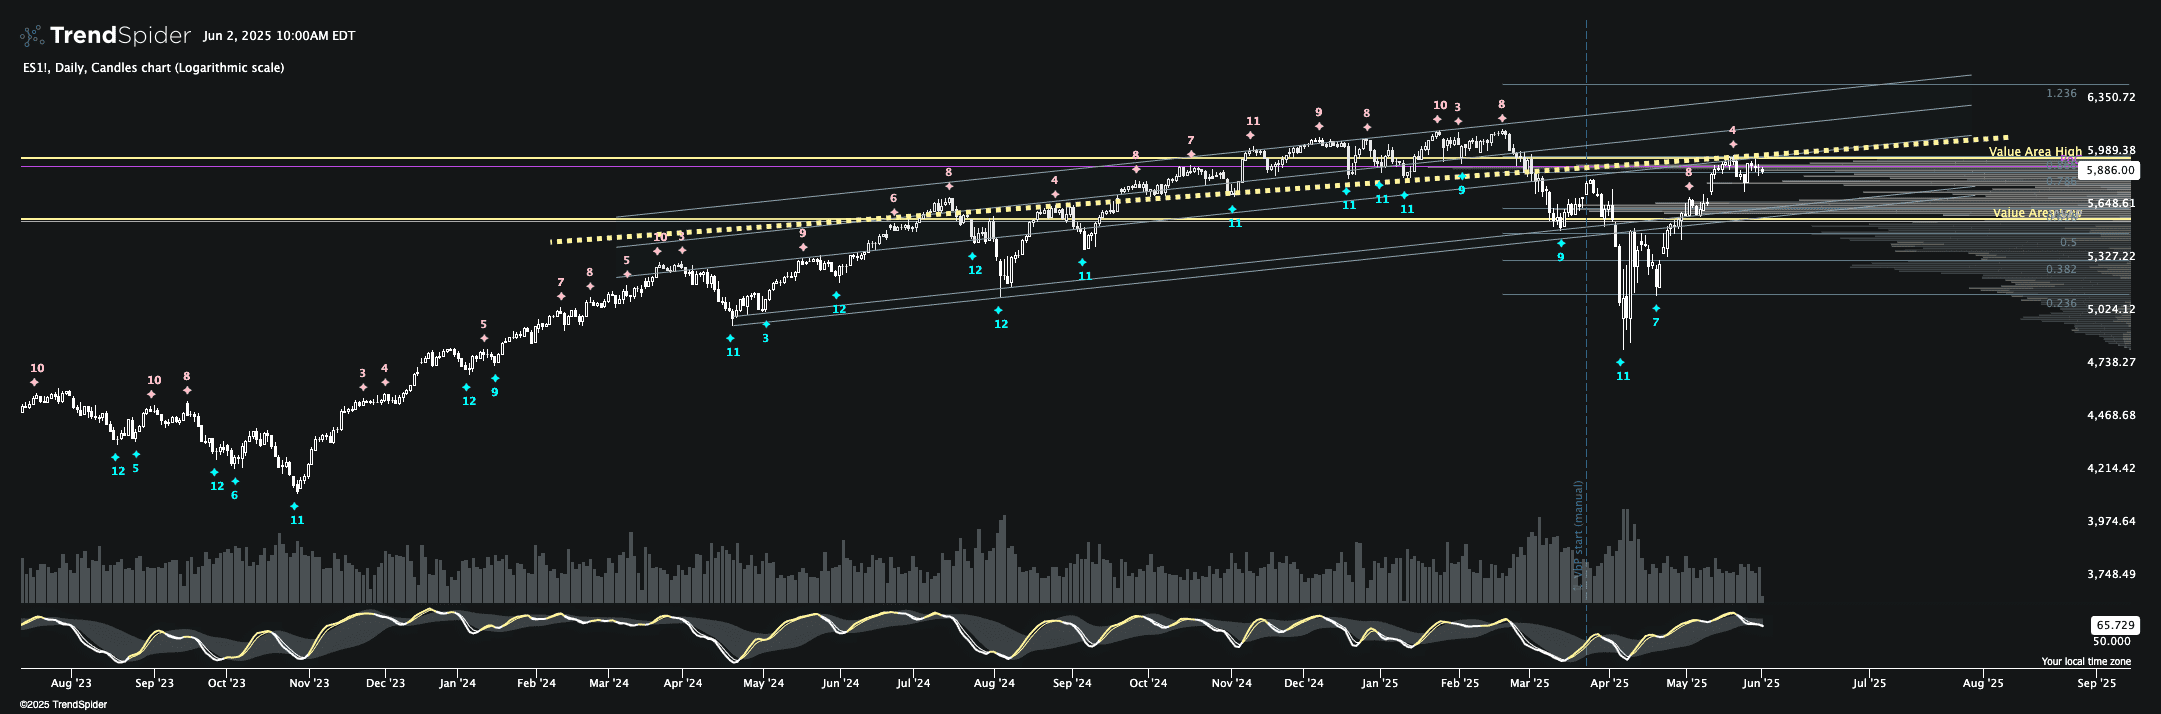
General idea
This indicator, named "QX OSB Score Markers 2.0", is designed to identify overbought and oversold conditions in the market using multiple technical indicators. It calculates a composite score based on the agreement of various indicators and paints markers on the chart when certain conditions are met.
Usage
The indicator uses a combination of popular technical indicators like MACD, RSI, PPO, MFI, CCI, Stochastic RSI, and others to determine overbought and oversold conditions. It then applies a scoring system and agreement calculation to generate signals. These signals are visualized on the chart as star-shaped markers (✦) at price extremes, with optional score numbers displayed.
Users can configure parameters such as the number of indicator agreements required for overbought and oversold conditions, persistence bars, and local window size. The indicator also incorporates ATR-based dynamic extreme guardrails to ensure signals occur at significant price levels.
Key features
- Multiple indicator integration: Combines 14 different technical indicators for a comprehensive analysis.
- Customizable parameters: Allows users to adjust sensitivity and other settings.
- Visual representation: Displays star-shaped markers on the chart for easy identification of signals.
- Score display: Optionally shows the number of agreeing indicators alongside the markers.
- ATR-based price extremes: Uses Average True Range to ensure signals occur at significant price levels.
- Signal registration: Registers overbought and oversold signals for use in other TrendSpider features like alerts or strategy testing.
This indicator aims to provide traders with a comprehensive tool for identifying potential reversal points in the market, based on the agreement of multiple technical indicators and price action.
Traders also viewed