
Have a question for TrendSpider Team?
Send Message
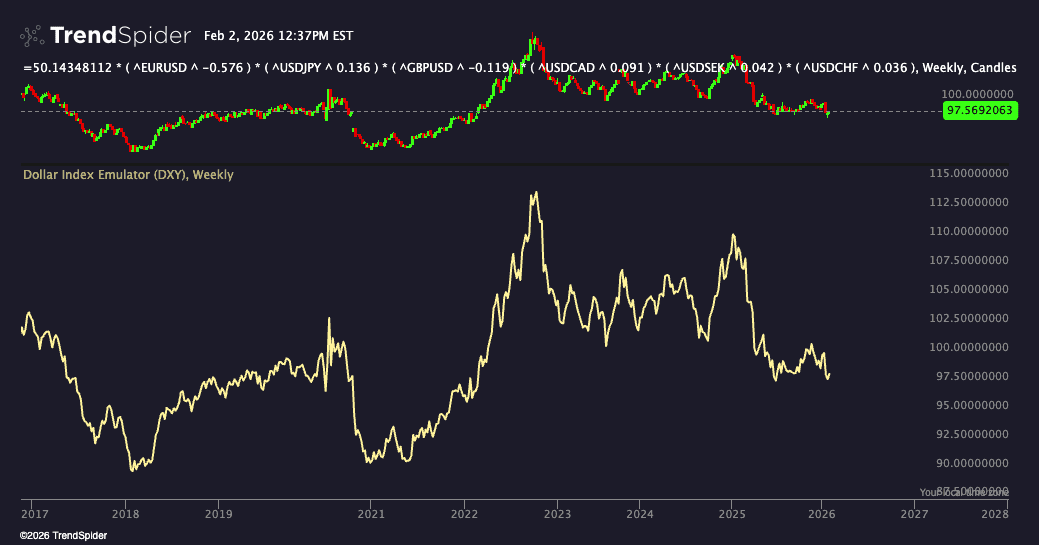
Dollar Index Emulator (DXY)
General Idea This indicator emulates the U.S. Dollar Index (DXY) by calculating it from scratch using the actual currency pair prices that compose it. Instead of just pulling the DXY...
ORB Trading Strategy Short Scanner
The ORB Trading Strategy Short Scanner finds stocks breaking below the opening range low in real time. Ideal for ORB day trading strategies, this scanner highlights short opportunities as they...

ORB Trading Strategy Long Scanner
The ORB Trading Strategy Long Scanner identifies stocks breaking above the opening range high in real time and within the last 10 candles. Built for traders using the ORB breakout...
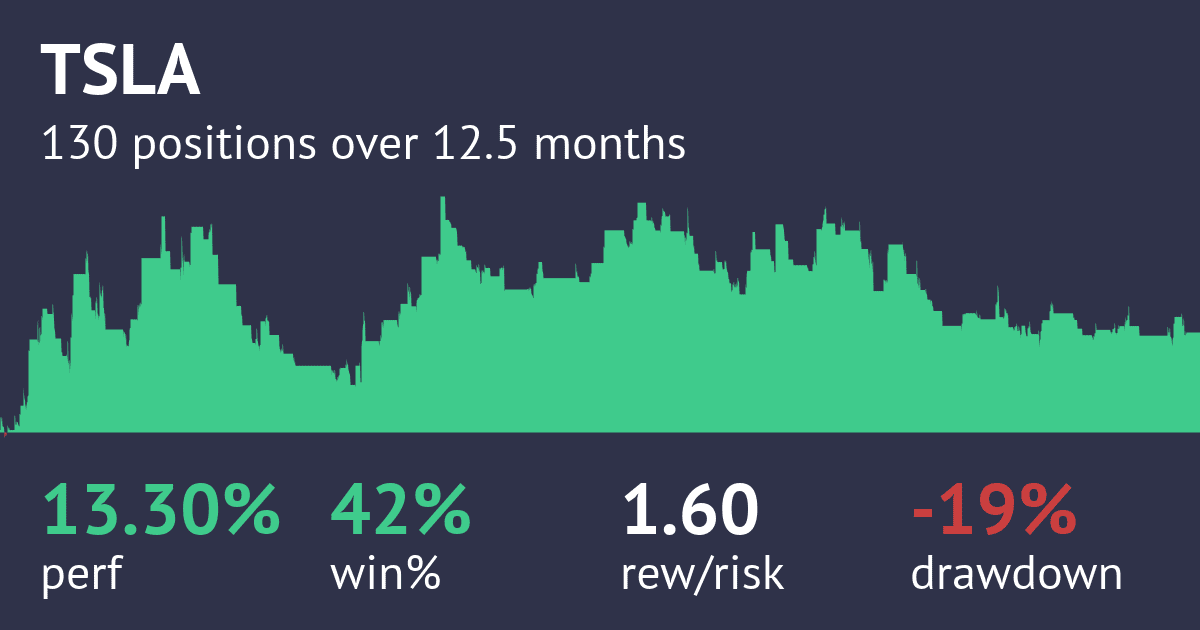
ORB Trading Strategy Backtest 3R Short
This ORB Trading Strategy bot is built specifically for backtesting downside Opening Range Breakout setups using intraday charts. The strategy operates on 1-minute, 5-minute, 10-minute, 15-minute, 30-minute, and 60-minute timeframes...
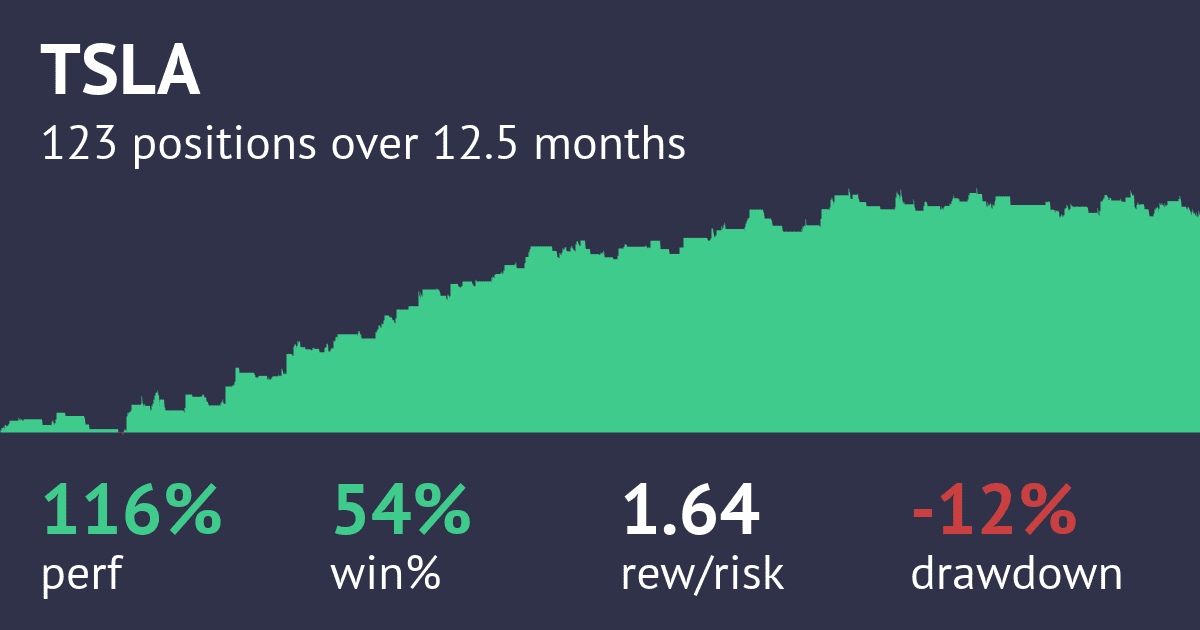
ORB Trading Strategy Backtest 3R Long
This ORB Trading Strategy bot is built specifically for backtesting Opening Range Breakout setups using intraday charts. The strategy operates on 1 minute, 5 minute, 10 minute, 15 minute, 30...
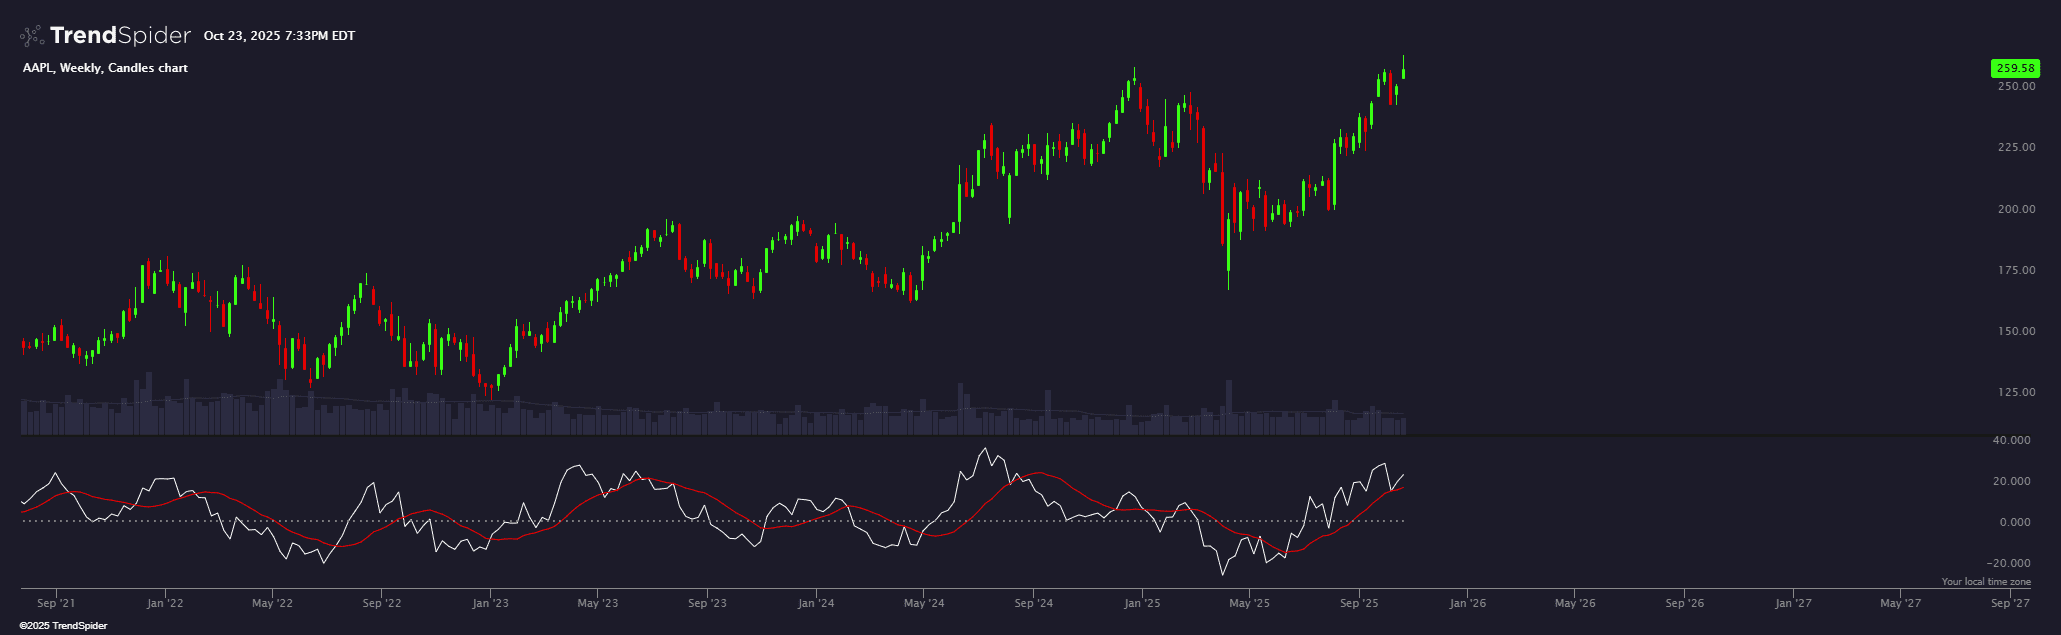
Rate of Change with MA
General Idea This indicator displays the Rate of Change (ROC) along with a smoothed moving average of the ROC in a separate panel below the main chart. The Rate of...
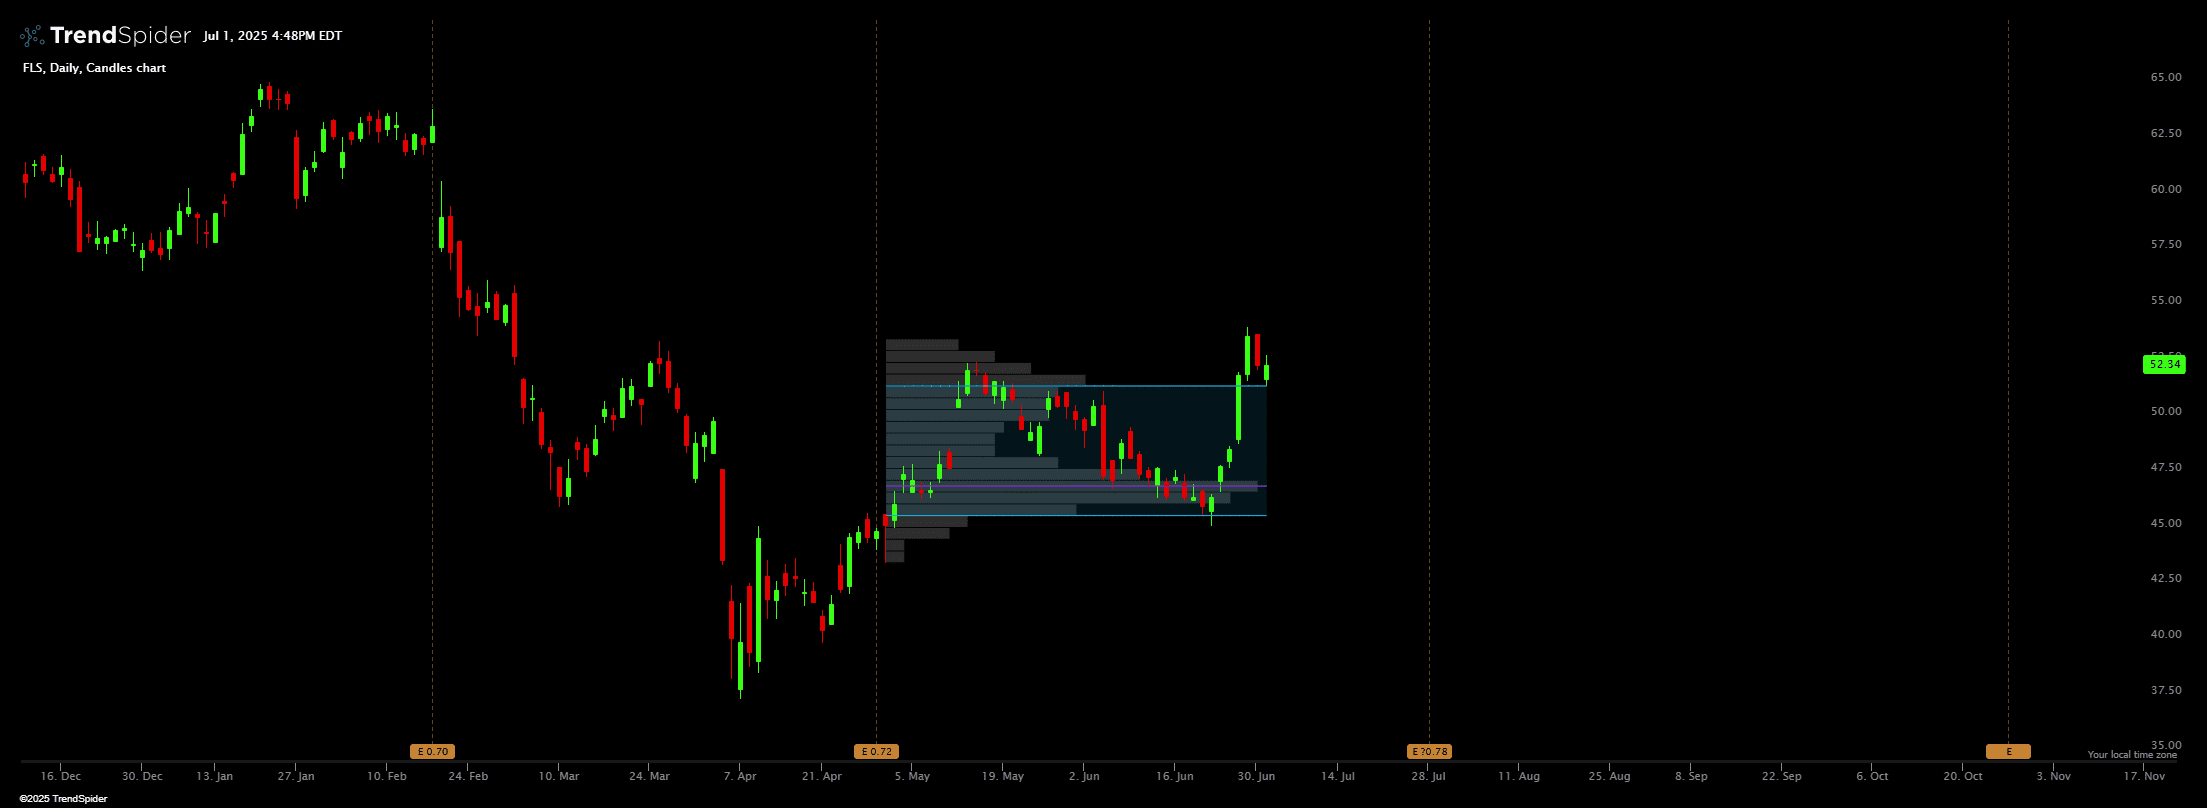
VbP from Earnings Indicator
General idea This indicator calculates and displays a Volume by Price (VbP) profile between earnings events for a given stock. It visualizes the trading volume distribution across different price levels,...
Example of a Pure Custom JS strategy
This is an example of a strategy which is fully coded in custom JS. This is the approach you take in case if you want to do things which our...

HTF Open Levels
Automatically plots the Daily, Weekly, Monthly, and Yearly Open prices on your chart—helping you track key reference points with ease. Customize colors, styles, and labels to fit your strategy.

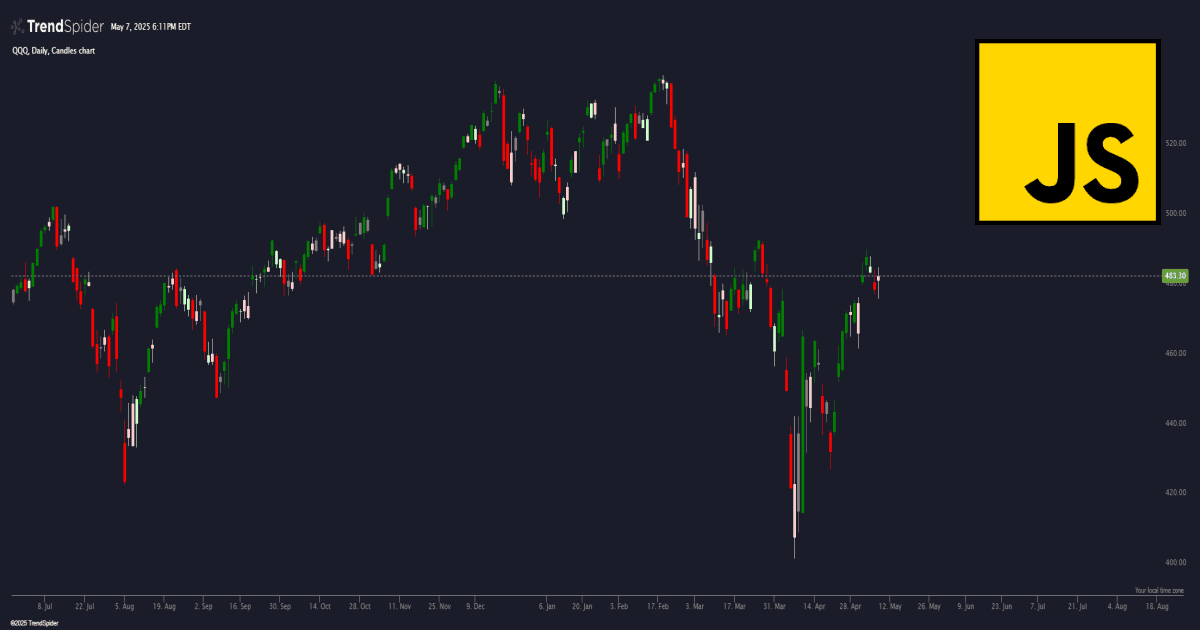
Breakout & Fakeout Candle Coloring
This indicator highlights candles based on breakout and breakdown conditions: Green: Breaks the prior high and closes above.Red: Breaks the prior low and closes below.Light Red: Breaks the prior high...
Customizable Candle Range
This indicator plots the highest high and lowest low over a user-defined lookback period based on a customizable price range (high-low, open-close, high-close, open-low). It displays: Green line for the...

Previous Day Levels
The Previous Daily Candle High, Low, and 50% Line Indicator plots dashed lines at the high, low, and 50% levels of the previous daily candle. It allows customization of line...
