Rock Regan
- 27 posts published
Have a question for Rock Regan?
Send Message
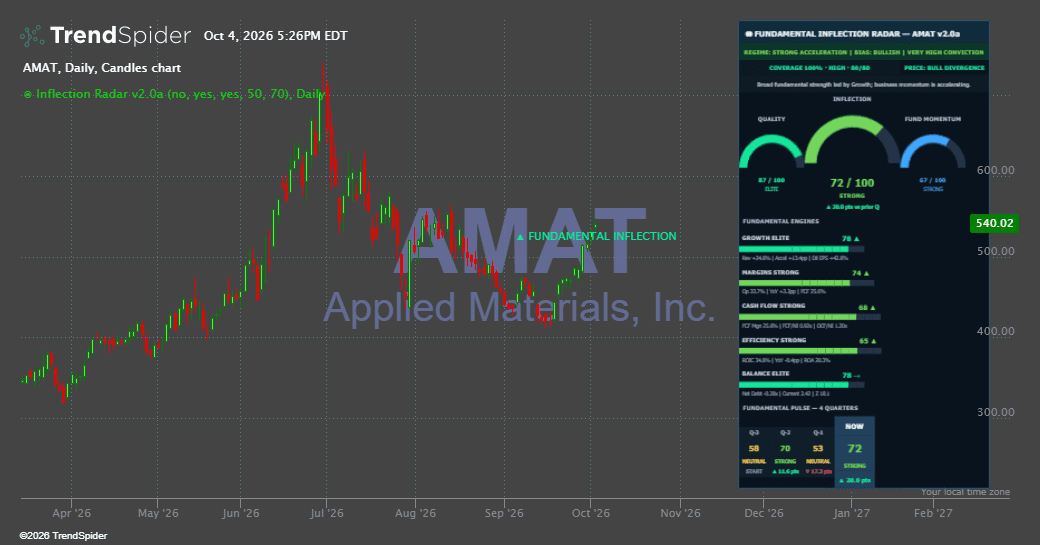
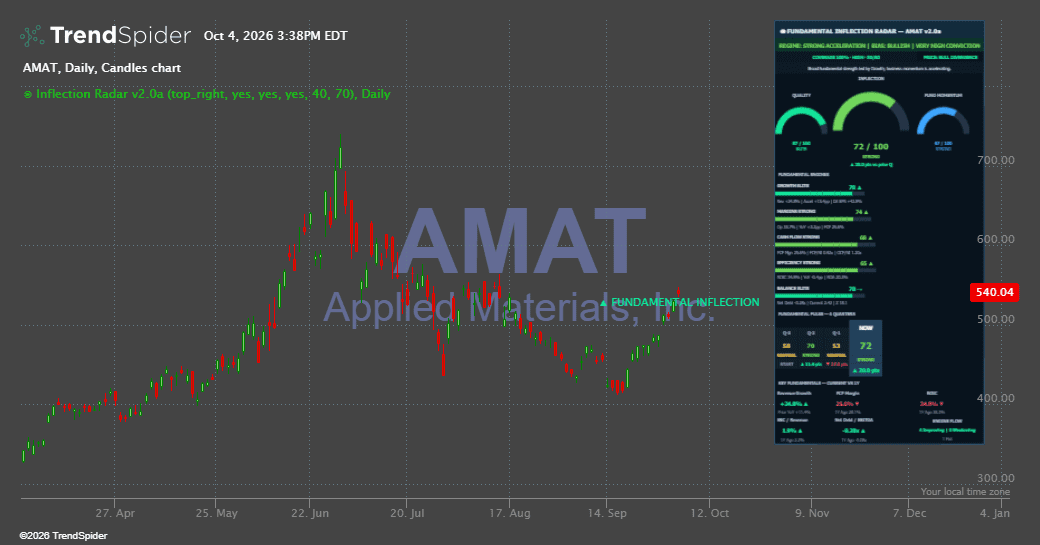
Fundamental Inflection Radar
Fundamental data tells you what a business already is. This tells you where it's turning. Most fundamental tools plot a line and leave the reading to you. Inflection Radar scores...
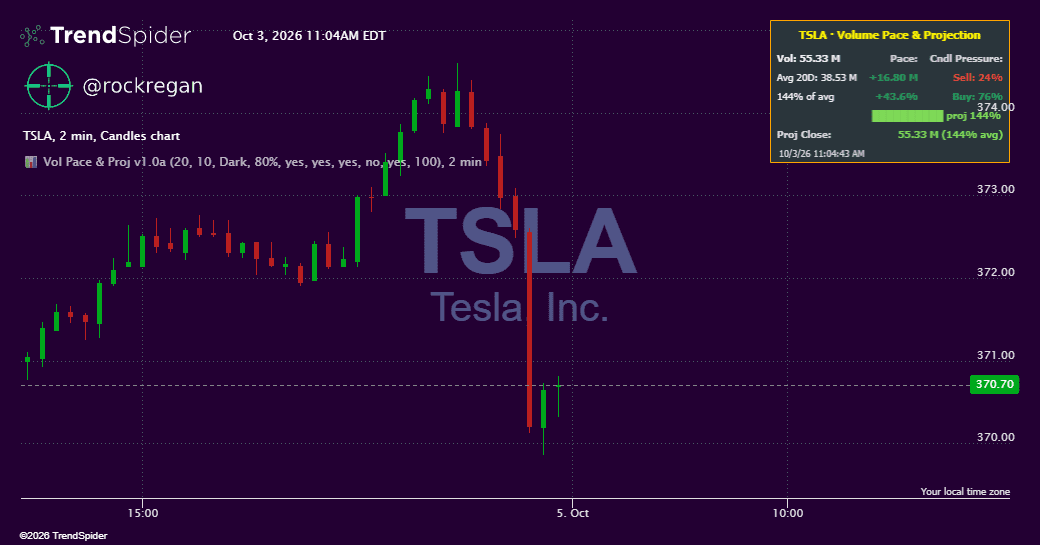
Volume Pace Curve
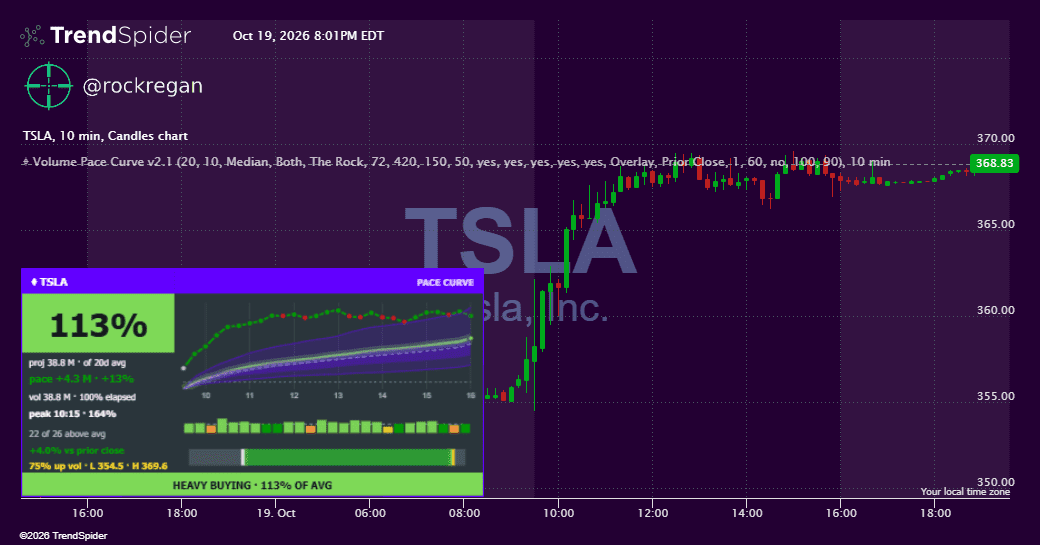
Today's volume against a normal day — and which way price went while it happened. #TSBuild26 Most relative-volume tools give you a number. Volume Pace Curve shows you the shape...
Spread Map
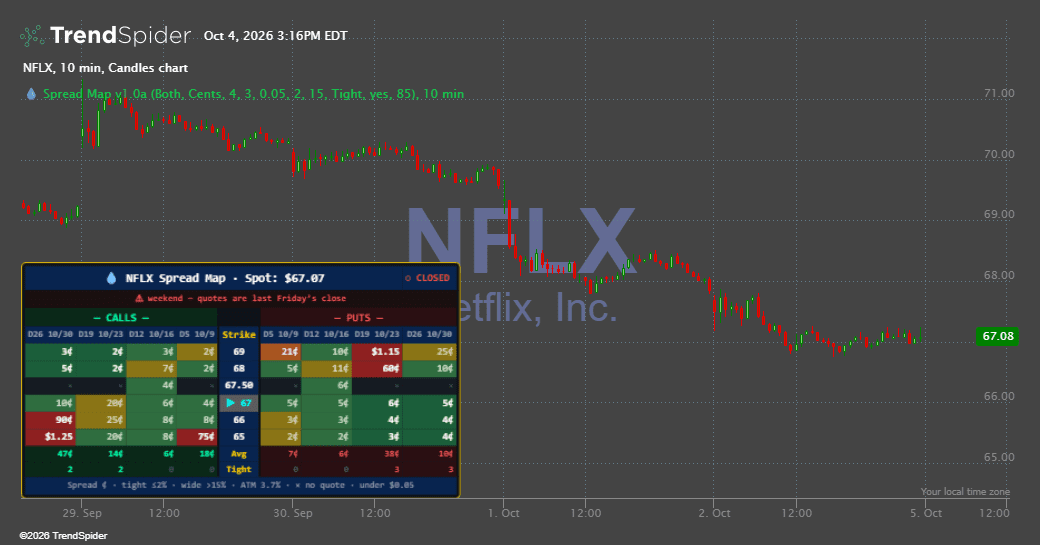
Spread Map puts the bid/ask spread of every strike on a grid — calls on the left, strikes down the middle, puts on the right — so you can see...
Fundamental Inflection Radar
Fundamental data tells you what a business already is. This tells you where it's turning. Most fundamental tools plot a line and leave the reading to you. Inflection Radar scores...
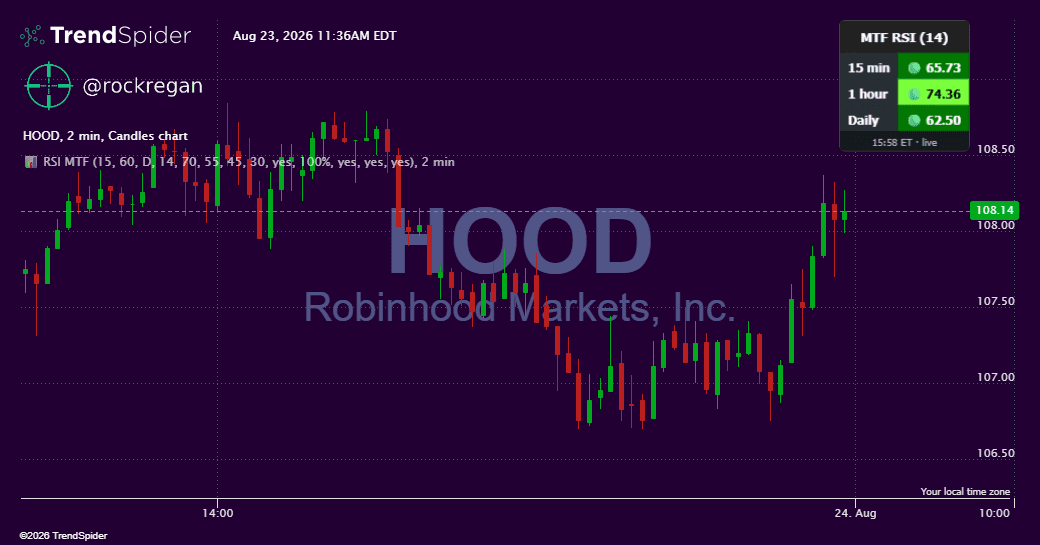
RSI MTF Stack
A clean multi-timeframe RSI dashboard designed to keep momentum context directly on your chart. RSI MTF Stack displays RSI readings from three user-selectable timeframes in a compact on-chart table, making...
Volume Pace & Projection
Is today's volume running light or heavy for this point in the session — and where is it on track to finish? This intraday overlay answers both by comparing volume...
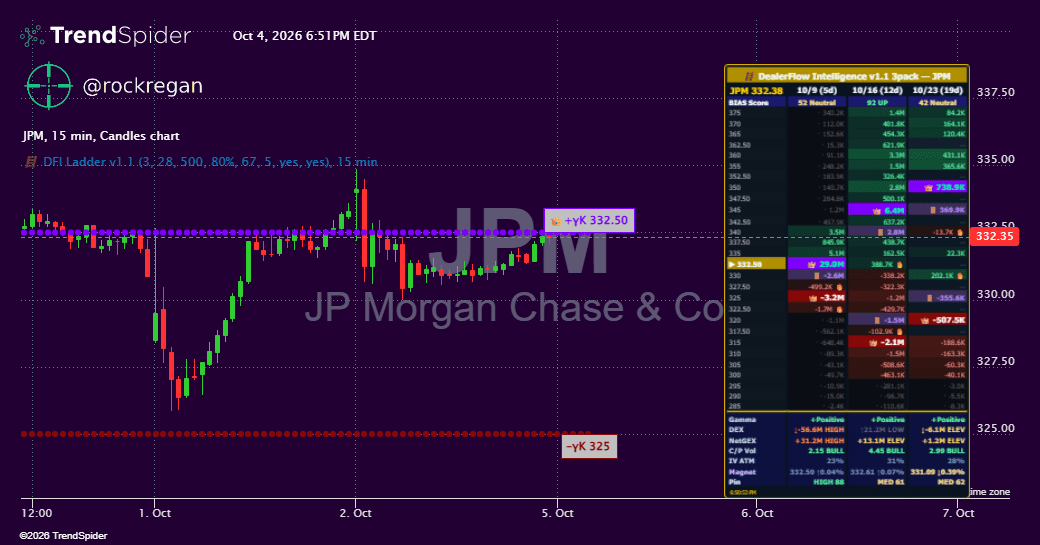
DealerFlow Intelligence
A GEX/DEX ladder showing dealer positioning across the next 3, 6, 9 or 12 expirations at once, on one shared strike grid. Most gamma tools show a single expiration. The...
Options Chain Grid
General Idea Options Chain Grid is a chart-overlay alternative to TrendSpider's native Options Grid widget. Instead of consuming dedicated screen real estate in the bottom widget panel, this indicator displays...

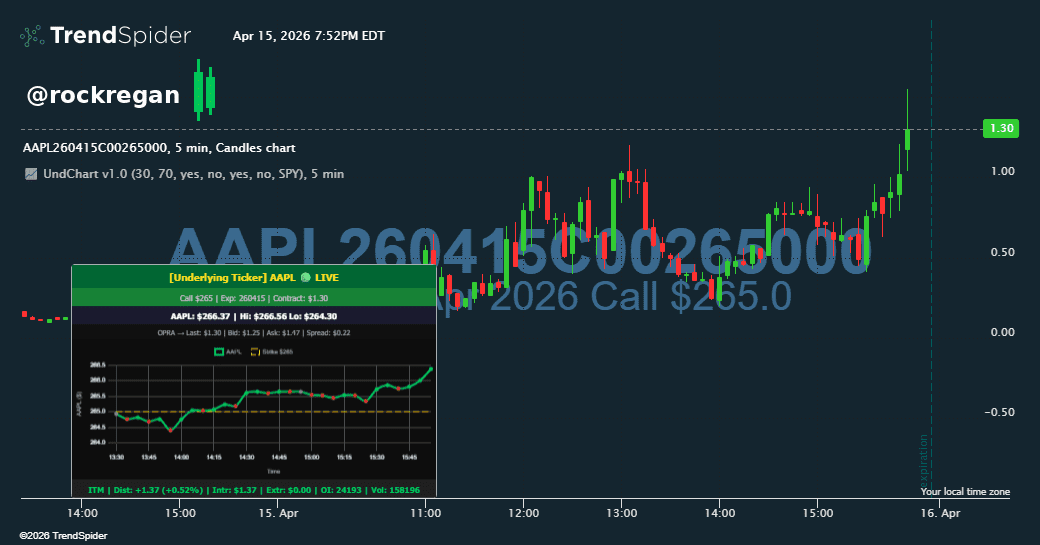
Underlying Chart Overlay
Underlying Chart Overlay General Idea This indicator is designed to be applied on an options contract chart (not on a stock chart). When you're viewing the price movement of an...
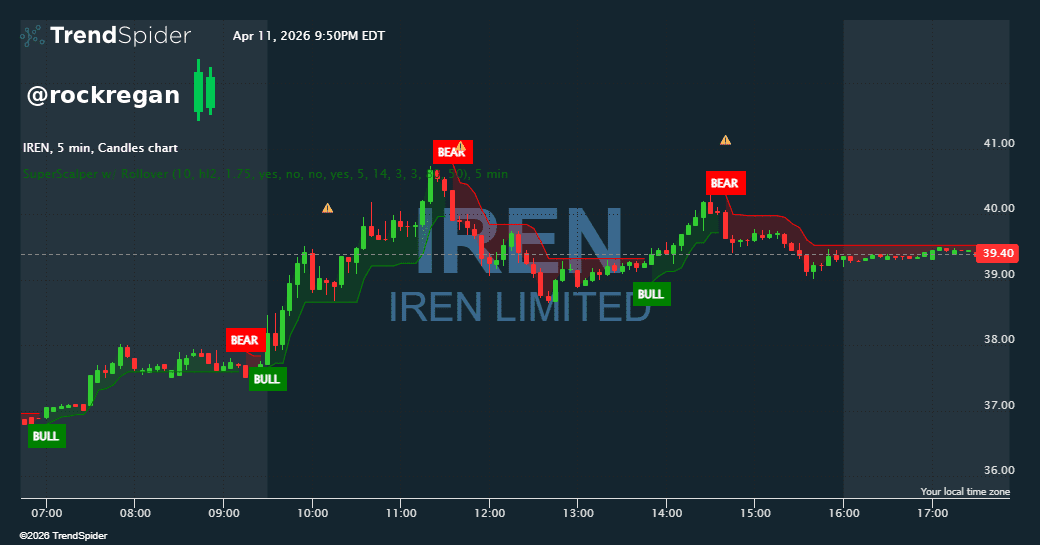
SuperScalper w/ Rollover
General Idea The SuperScalper w/ Rollover combines two complementary systems: a tightened SuperTrend-based trend follower and a Rollover signal that detects overbought exhaustion. Built on the classic SuperTrend indicator with...
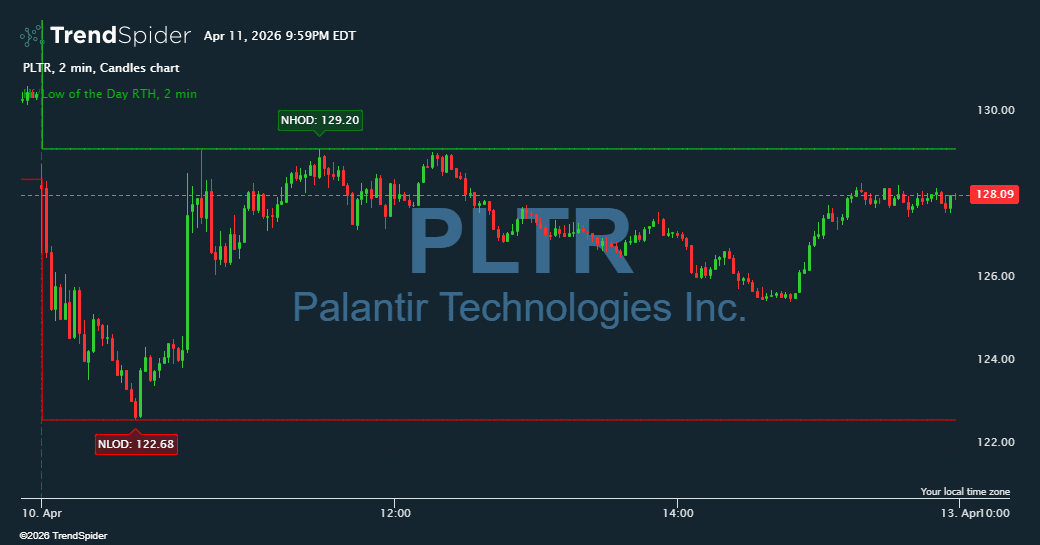
Hi/Low of the Day RTH
General Idea This indicator tracks and displays the High of the Day (HOD) and Low of the Day (LOD) for each trading session. It automatically adapts to the asset type:...
Options Contract Chart Overlay
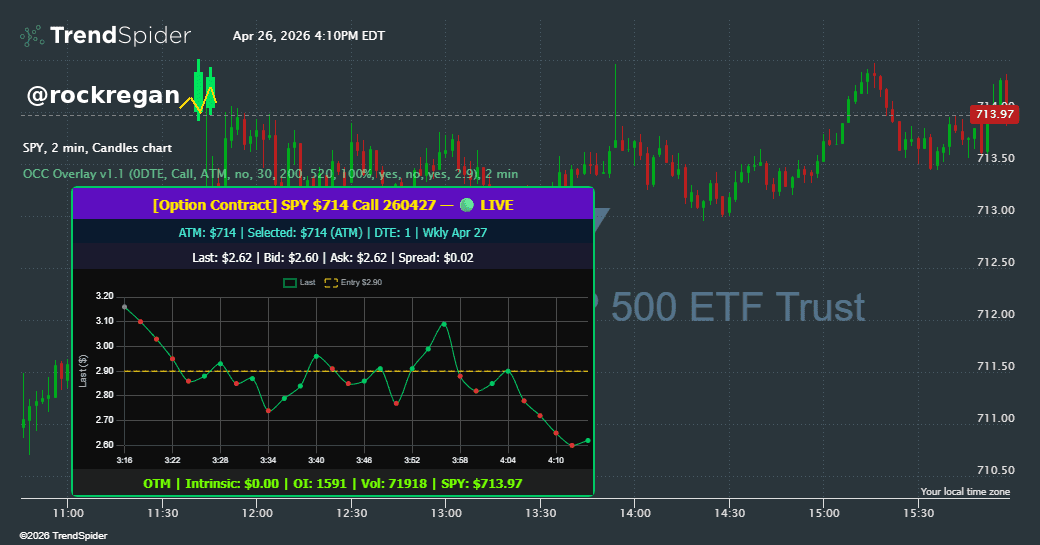
Options Contract Chart Overlay displays a live options contract price chart directly on your underlying stock chart (Requires OPRA Data Subscription) — no need to switch charts to monitor contract...