

Woodies CCI: A Comprehensive Guide
What is Woodies CCI?
History of Woodies CCI
Woodies CCI is a technical analysis indicator developed by Ken Woods, building upon the principles of the original Commodity Channel Index (CCI) created by Donald Lambert in 1980. The Woodies CCI is an oscillator that measures a security’s price deviation from its statistical mean, helping traders and investors identify potential trading opportunities and market trends.
How Woodies CCI Works
Like the original CCI, Woodies CCI calculates the difference between the typical price of a security (the average of high, low, and close prices) and its simple moving average (SMA). This difference is then divided by the mean absolute deviation (MAD) to create an oscillator that fluctuates around the zero line. Unlike the traditional CCI, the Woodies CCI incorporates additional lines, such as the Turbo CCI and the Super Woodies CCI, to provide a more comprehensive view of market conditions.

Example Scanners based on Woodies CCI
Woodies CCI can be used in Scanning the market. To see how exactly it can be used in this way, we provide the following samples. Both scanners search the market for stocks using this indicator.


Understanding Woodies CCI Patterns
The Woodies CCI indicator reveals various patterns that can help traders make informed decisions. Some key patterns include the Zero Line Reject, Trend Continuation, and Divergence.
Zero Line Reject
The Zero Line Reject is a pattern that occurs when the CCI approaches the zero line but reverses direction before crossing it. This pattern often indicates a strong trend continuation and can be a signal to enter or exit a trade in the direction of the trend.
Trend Continuation
Trend Continuation patterns occur when the Woodies CCI remains above or below the zero line for an extended period, indicating a strong uptrend or downtrend. Traders can use this information to determine the market’s direction and identify potential entry or exit points.
Divergence
Divergence is a pattern where the price of a security and the Woodies CCI move in opposite directions. This can be a bullish or bearish signal, depending on whether the divergence is positive or negative. Positive divergence occurs when the price makes a lower low while the CCI makes a higher low, which can signal a potential trend reversal to the upside. A negative divergence occurs when the price makes a higher high while the CCI makes a lower high, indicating a possible trend reversal to the downside.
How to Use Woodies CCI in Trading
Trading Strategies
Various trading strategies can be employed using Woodies CCI, such as trend following, counter-trend, and breakout strategies. Traders should consider their risk tolerance and objectives when selecting a strategy and combine the Woodies CCI with other technical indicators to confirm signals.
Risk Management
Proper risk management is essential when using Woodies CCI in trading. Traders should set stop-loss orders to protect their investments and consider using a trailing stop to lock in profits as the market moves in their favor. Additionally, traders should avoid overexposure to a single trade and diversify their portfolios to minimize the risk associated with market fluctuations.
Advantages and Limitations of Woodies CCI
Advantages
- Versatility: Woodies CCI can be applied to various financial instruments, including stocks, commodities, and currencies.
- Improved signals: The addition of the Turbo CCI and Super Woodies CCI enhances the accuracy of the signals generated by the original CCI.
- Trend identification: Woodies CCI helps traders identify potential trend reversals and continuations, providing valuable information for trade entries and exits.
Limitations
- False signals: Woodies CCI, like other technical indicators, can generate false signals, leading to potential losses.
- Lagging nature: Being a derivative of price, Woodies CCI may lag behind real-time market movements, which can result in late trade entries or exits.
Overcoming Limitations
To overcome the limitations of Woodies CCI, traders should combine it with other technical indicators and tools, such as moving averages, trendlines, and support and resistance levels. Additionally, traders should apply proper risk management techniques and develop a well-defined trading plan to minimize the impact of false signals and the indicator’s lagging nature.
Example Strategy based on Woodies CCI
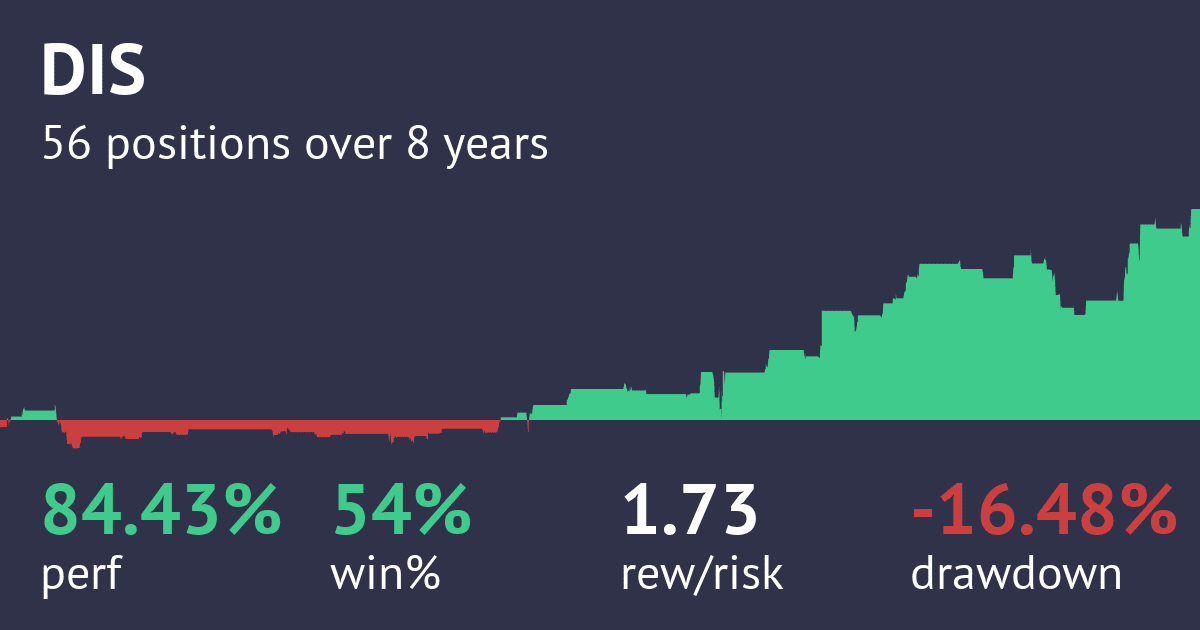
Woodies CCI can be used in Testing Strategies. To see how exactly it can be used in this way, we provide the following sample. The strategy tests buying and selling rules built around this indicator.
The bottom line
Woodies CCI is a versatile and powerful technical analysis tool that builds upon the principles of the original CCI. By understanding the patterns revealed by Woodies CCI, traders can make more informed decisions and develop effective trading strategies. However, it’s essential to recognize the limitations of the indicator and combine it with other technical tools and sound risk management practices to improve overall trading performance.


