

Harami Candlestick & Harami Cross Candlestick Patterns: Trader’s Strategy Guide
Two of the most widely used technical analysis tools and two of the most utilized are the candlestick patterns, which help traders to analyze price psychology as well as predict potential market reversals. The Harami and Harami Cross candlesticks are among them for their ability to indicate likely reversals after an intense trend. This guide explains what they are, how to trade and identify them, and how to incorporate them within your trading strategy.

Key Takeaways
- Momentum Dying: The Harami pattern suggests that the current trend is fading out — buyers or sellers are no longer completely in charge.
- Tighter Reversals with Doji: The Harami Cross with a Doji creates maximum uncertainty and tends to create even tighter trend reversals.
- Confirmation is Key: Always wait for the next candle to confirm direction and wait for agreeing indicators before taking action.
- Context + Risk Management = Success: The best indications are near key support/resistance levels and with the correct stop-loss.
What Are the Harami and Harami Cross Candlesticks?
The Harami is a two-candlestick reversal pattern that appears within a strong uptrend or downtrend. The first candlestick — often called the “mother” — has a large real body that represents the dominant trend. The second — known as the “child” — is smaller and completely contained within the body of the first. This smaller candle represents a loss of momentum or market hesitation, suggesting the ongoing trend could be running out of steam.
A bullish Harami is the case where the big bear candle is followed by a small bullish candle in a downtrend. It implies that sellers lose steam and the buyers may enter. A bearish Harami is the case where the big bullish candle is preceded by a small bearish candle in an uptrend. It implies weak buying pressure.
The Harami Cross is a type of Harami pattern. The second candlestick in this case is a Doji — when opening and closing prices are nearly the same. The Doji contributes to the impression of indecision in the market, and hence the Harami Cross is a stronger reversal indication than a typical Harami.
How to Identify the Harami and Harami Cross Patterns
1. Look for an existing trend:
They are more significant when they occur after a long uptrend (in the case of bearish Harami) or downtrend (in the case of bullish Harami).
2. Notice the two-candle structure:
- Candle 1 (Mother): Significant real body in the direction of the ongoing trend.
- Candle 2 (Child): Small body opening and closing inside the range of the first candle.
3. Find the Harami Cross variation:
If the second candle is a Doji, open ≈ close, then it becomes a Harami Cross.
4. Verify in context:
It is stronger if it occurs in regions of major support or resistance, on spike volume, or on divergences in indicators like RSI or MACD.
How to Trade the Harami and Harami Cross Candlesticks?
1. Recognize the Pattern:
Look for the two-candle pattern in the trending market.
- The first candle indicates trend strength.
- The second smaller candle or Doji indicates weakening momentum.
2. Wait for Confirmation
Do not enter trades prematurely. Wait for the next candle to confirm the reversal — for example, a bullish candle closing above the Harami’s high in a bullish setup, or a bearish candle closing below the Harami’s low in a bearish setup.
3. Combine with Technical Indicators
Use support/resistance, moving averages, or oscillators like RSI and MACD to validate the pattern. For instance, in the event of a bullish Harami close to a strong support level and the RSI is oversold, the reversal signal is that much stronger.
4. Enter the Trade
Trade in the direction of the reversal when confirmed:
- Bullish Harami: Buy following a bullish confirmation candle.
- Bearish Harami: Sell short following a bearish confirmation candle.
5. Risk Management
Position stop-losses judiciously:
- In the event of a bullish pattern, position a stop below the low of the “mother” candle.
- For a bearish formation, place it higher than the high of the mother candle.
Employ a minimum risk-to-reward ratio of 1:2 to ensure long-term profitability.
6. Confirm With Volume
More volume in the confirmation candle reinforces the reversal. It implies institutional trader participation or robust market interest in the new direction.
Trading Tips for the Harami and Harami Cross Candlesticks
- Look for market structure: More precise shapes at major support/resistance levels.
- Look at larger timeframes: 4-hour or daily charts provide stronger signals than intraday 5-minute charts.
- Look with trendlines/EMAs: A Harami at a major moving average (like 50 EMA) can reinforce reversal conviction.
- Steer clear of false signals: These patterns will not work in range-bound markets.
- Employ strict stop-losses: Always risk before.
- Don’t trade without confirmation: One two-candle pattern is not sufficient to predict direction reversals.
Example scanners based on The Harami and Harami Cross Candlesticks
You can automate your analysis using scanners that detect these patterns in real time. Examples below are from TrendSpider, which scans for stocks exhibiting Harami or Harami Cross patterns.
- “Any Harami Candle Example” scanner by Dan Ushman; Prepares both bearish and bullish Harami patterns in timeframes.
- “Harami Cross Example Scanner” scanner by Dan Ushman; Recognizes Harami Cross patterns where the second candle is a Doji.
These scanners enable traders to spot possible reversals early on and confirm them with other indications or chart formations.

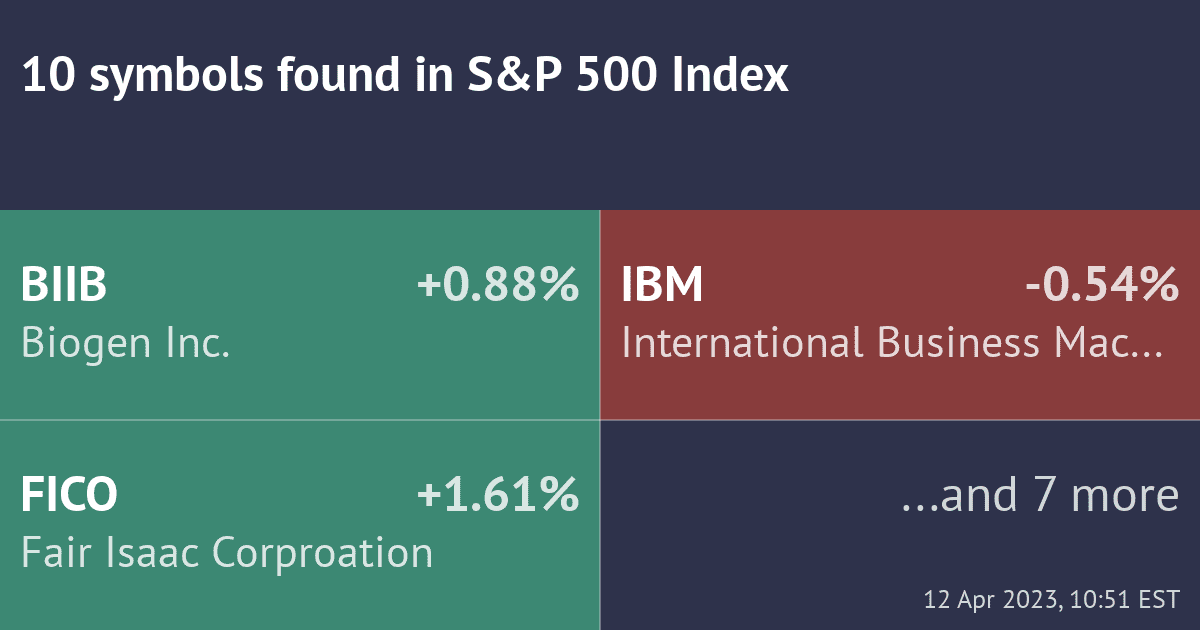
Example of the Harami and Harami Cross Candlesticks
Let’s illustrate how these setups appear on real charts:
Example 1: Bullish Harami in a Downtrend
A stock has been declining for several sessions, producing long red candles. Then, a smaller green candle is found within the body of the red candle — a Bullish Harami. This is a signal that selling pressure is decreasing. If the following candle breaks out above the high of the short candle, it indicates a reversal to the up side.
Example 2: Bearish Harami Cross in an Uptrend
Suppose a market has been rising strongly with multiple green candles. Then a small Doji appears within the prior candle’s body — forming a Bearish Harami Cross. The Doji represents uncertainty, showing that buyers are losing control. A subsequent bearish candle closing below the pattern confirms the reversal.

Common Mistakes to Avoid
- Relying solely on the pattern without confirmation.
- Ignoring market context (e.g., forming mid-trend).
- Over-leveraging based on one signal.
- Trading on low-volume setups.
Use these candlesticks as part of a broader price-action strategy rather than isolated entry triggers.
FAQs
What is the Harami candlestick pattern and how is it different from a Harami Cross?
Harami means a small candle within the previous larger one, signaling a slowdown in momentum. The Harami Cross is a variation of this pattern that includes a Doji as the second candle, demonstrating very strong indecision and/or a heightened probability of reversal.
Does the Harami candlestick pattern work for day trading?
Yes. This pattern might happen in any timeframe, but it works much more predictably on higher ones: 4-hour, daily, or weekly charts, where the market noise is less.
How do I identify a Bullish or Bearish Harami candlestick pattern?
A Bullish Harami candlestick pattern occurs in a downtrend when a small green candle shows up inside a large red one. A Bearish Harami candlestick pattern forms in an uptrend when a small red candle is contained within a larger green candle, signaling probable reversal.
Can Harami candlestick patterns fail?
Yes. The Harami candlestick pattern may fail in low-volume or choppy markets. Always confirm through indicators such as RSI or MACD, and apply stop-losses.
Do the Harami candlestick patterns work in crypto or forex trading?
Of course, the Harami candlestick and Harami Cross candlestick patterns work across all markets, whether it be stocks, crypto, forex, or commodities, since they reflect universal market psychology.


