

Overview of Double Exponential Moving Average (DEMA)
The Double Exponential Moving Average (DEMA) is a trend-following technical indicator designed to reduce the lag associated with traditional moving averages. Introduced by Patrick Mulloy in 1994, DEMA enhances the responsiveness of the Exponential Moving Average (EMA) by combining two EMA calculations in a unique formula:
DEMA(n)=2×EMA(n)−EMA(EMA(n))
This approach minimizes delay in reacting to price changes while preserving the smoothing benefits of a moving average, making DEMA especially valuable for short-term traders seeking timely signals in fast-moving markets. In this article, we will explore the DEMA and its uses in trading.
How the Double Exponential Moving Average Works
The Double Exponential Moving Average (DEMA) is a modified moving average designed to reduce the lag that typically occurs with traditional moving averages. Unlike a standard EMA, DEMA applies the exponential moving average formula twice using the same period: once to the price data and again to the result of the first EMA. It then subtracts the second EMA from twice the first, using the formula:
DEMA=2×EMA(n)−EMA(EMA(n))
This construction makes DEMA more responsive to price movements, offering a smoother yet faster-reacting signal compared to standard EMAs or simple moving averages (SMAs). Because it only requires a single period input, DEMA is simple to configure and can be tailored to both short- and long-term trading strategies.
What Does the Double Exponential Moving Average Tell You?
The Double Exponential Moving Average (DEMA) is a trend-following technical indicator designed to measure price direction while minimizing the lag found in traditional moving averages. It is calculated using a unique formula that involves two exponential moving averages of the same period, with one applied to the result of the other. This structure makes DEMA more responsive to recent price changes, helping traders identify potential trend shifts sooner than with standard simple or exponential moving averages.
While DEMA can provide a faster signal, it is not a standalone tool for buy or sell decisions. Traders often use it in combination with other indicators or chart patterns to confirm entry and exit points in volatile markets.
Advantages of Using DEMA
The DEMA technique has been shown to have several distinct advantages over traditional moving average strategies. DEMA has the unique ability to provide clearer buy and sell signals in comparison to traditional techniques, allowing for better entry and exit points for technical traders. Additionally, by using two different EMAs as part of its calculation, DEMA is able to identify price trends faster than other methods, enabling quicker action when markets are shifting. Finally, since the indicator itself takes both long-term and short-term trends into account simultaneously, it can be used as a reliable tool for predicting future market movements. All in all, the Double Exponential Moving Average provides an incredibly useful technique to any trader looking to maximize their potential profits in volatile markets.
Examples of DEMA in Action
The DEMA is a popular technical indicator used by traders to identify trends in financial markets. In this section, we will discuss some examples of DEMA in action. DEMA can be used in a variety of ways, but one common approach is to look for crossovers between the DEMA and price action. When the DEMA crosses above the price, it can signal a bullish trend, while a crossover below the price can indicate a bearish trend. Charts can be used to visualize these signals, with traders using technical analysis tools to identify potential buy and sell signals. Additionally, traders often compare the DEMA with other popular moving averages, such as the Simple Moving Average (SMA) or Exponential Moving Average (EMA), to confirm signals and improve their trading strategies. Finally, traders may backtest the DEMA using historical price data to see how it would have performed in different market conditions.

Potential Drawbacks of DEMA
One potential drawback of the DEMA trading strategy is the issue of lagging. When utilizing this approach, as prices move up and down beyond the current EMA, a significant degree of lag can occur as you wait for two EMAs to cross. This may result in missing portions of an uptrend or downtrend, and traders need to be aware that no trading system is perfect, especially when it comes to the speed at which profits are realized. Another downside of using this strategy is that there can be undefined areas where false signals or whipsaws can occur. These false signals have been known to produce losses despite following a considered viable strategy, so traders should remain mindful while employing this method – and all methods – of technical analysis.
Example scanners and strategies that use Double Exponential Moving Average
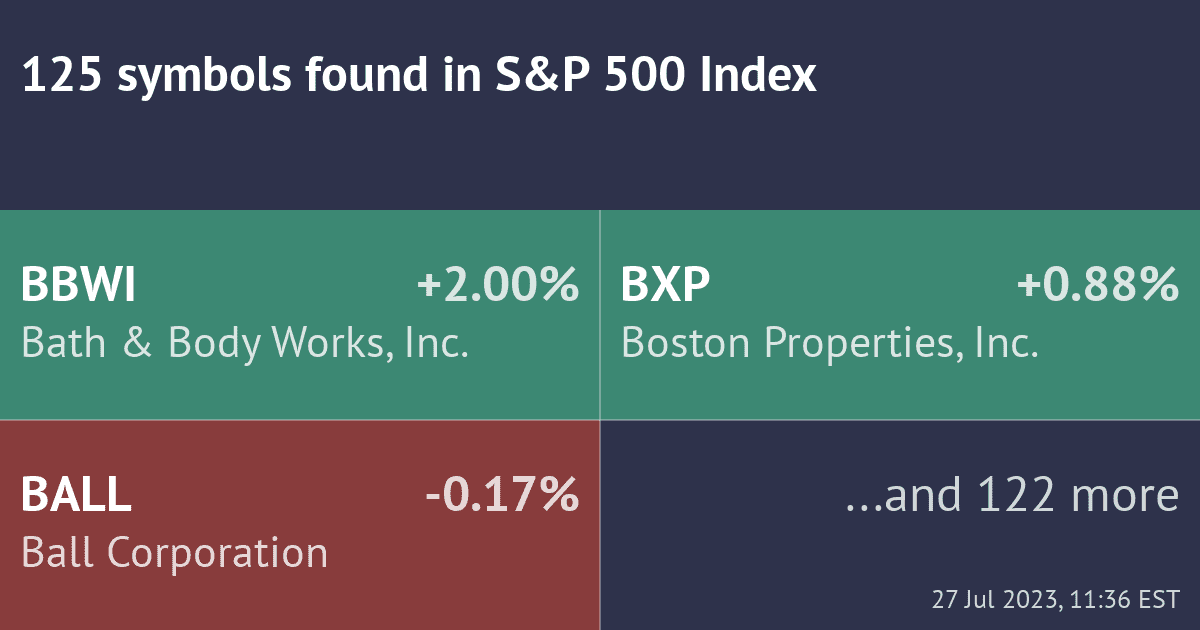
The Double Exponential Moving Average can be used in both Scanning the market and Testing Strategies. To see how exactly it can be used in these ways, we provide the following samples. The scanner searches the market for stocks using this indicator, and the strategy tests buying and selling rules built around this indicator.

The Bottom Line
In conclusion, the Double Exponential Moving Average (DEMA) stands out as a sophisticated technical analysis tool that traders use to gain a competitive edge in the market. The DEMA’s unique features, including reduced lag time, accurate signal identification, and customizable parameters, make it a popular choice among traders who value technical analysis. However, traders must be mindful of potential drawbacks such as the DEMA’s high sensitivity to price fluctuations, which can result in erroneous signals during periods of market turbulence, and the risks associated with over-optimization. Additionally, beginners may find DEMA’s calculation formula and parameters complex, making it challenging to use effectively. Traders are encouraged to consider DEMA in combination with other technical analysis tools, in addition to developing an in-depth understanding of market trends and effective risk management strategies. With a measured approach, DEMA has the potential to be a valuable addition to a trader’s toolkit, providing insights into market trends and helping to inform profitable trading decisions.


