

Envelope Indicator Basics: A Practical Guide for Technical Traders
Introduction
The Envelope Indicator is a popular technical analysis tool traders and investors use to identify potential trading opportunities in the financial markets. It helps to determine overbought and oversold conditions, trend direction, and possible support and resistance levels. This indicator is easy to implement and interpret, making it suitable for beginners and experienced traders.
Understanding the Envelope Indicator
The Envelope Indicator consists of a simple moving average (SMA) and two parallel lines or bands above and below the moving average, which are calculated as a percentage of the SMA.

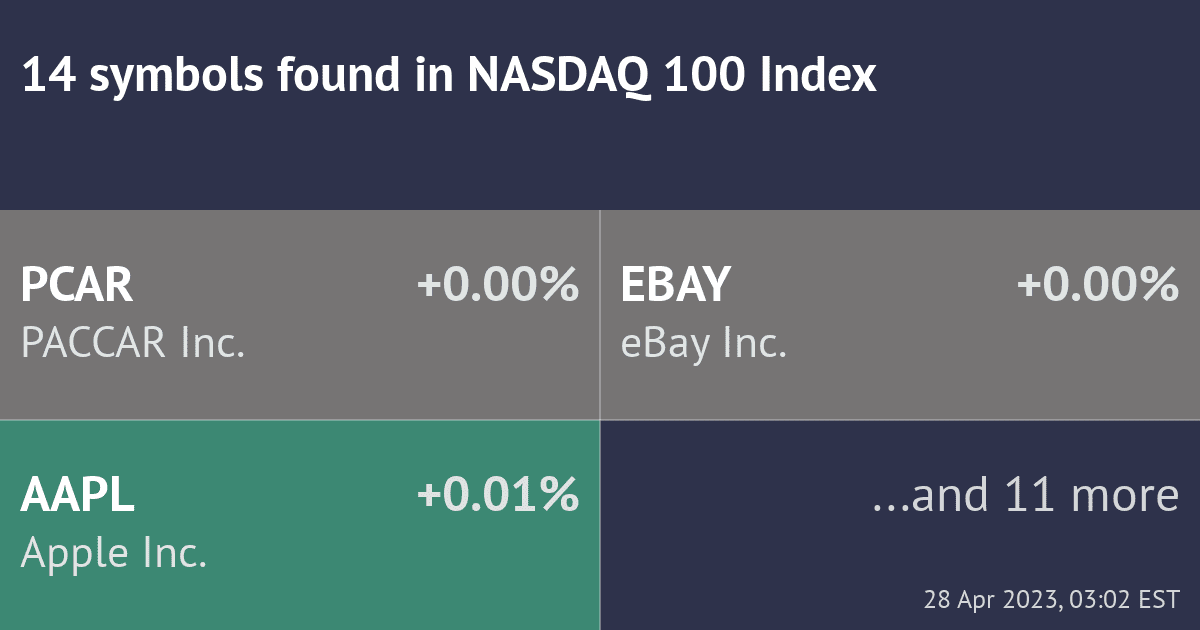
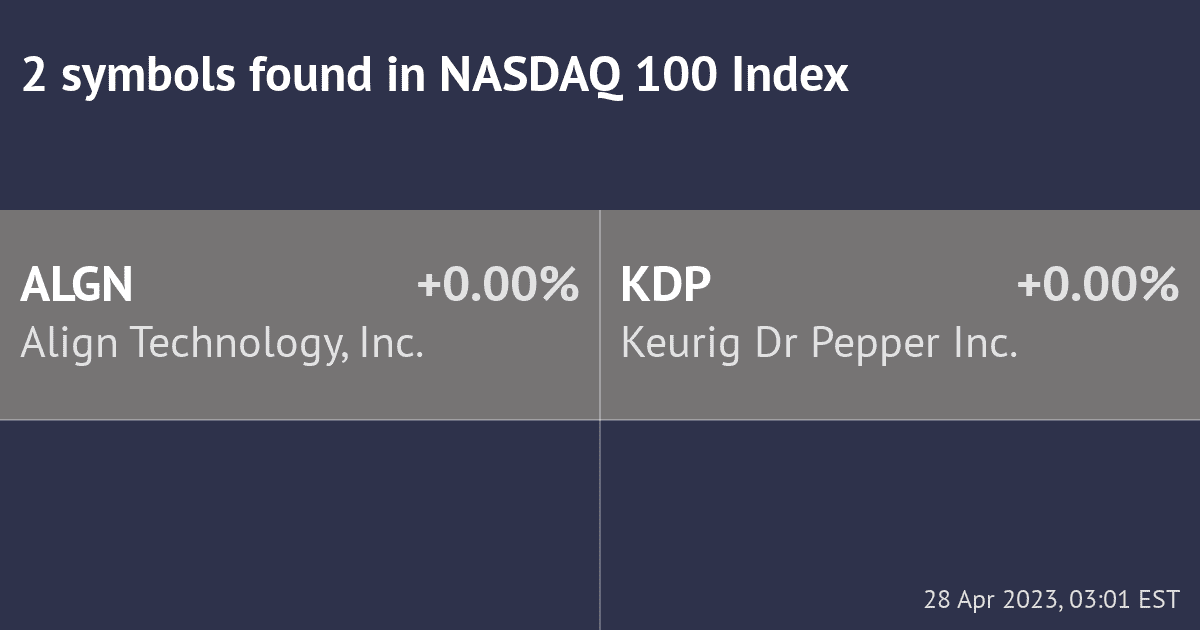
Example scanners based on Envelope Indicator
The Envelope Indicator can be used in Scanning the market. To see how exactly it can be used in this way, we provide the following samples. Both scanners search the market for stocks using this indicator.
Calculating the Envelope Indicator
To calculate the Envelope Indicator, follow these steps:
- Choose a time frame for the moving average (e.g., 20 periods).
- Calculate the SMA for the chosen time frame.
- Determine the percentage deviation from the SMA (e.g., 2%).
- Calculate the upper envelope by adding the percentage deviation to the SMA
(Upper Envelope = SMA + (SMA * Percentage Deviation)). - Calculate the lower envelope by subtracting the percentage deviation from the SMA
(Lower Envelope = SMA - (SMA * Percentage Deviation)).
Parameters of the Envelope Indicator
The two main parameters are the time frame for the SMA and the percentage deviation. The time frame for the SMA determines the indicator’s sensitivity to price fluctuations, while the percentage deviation establishes the distance between the bands and the SMA. Traders can customize these parameters to suit their trading style and risk tolerance.
Interpreting Envelope Indicator Signals
Overbought and Oversold Conditions
When the price touches or moves outside the upper envelope, it indicates an overbought condition, suggesting that the asset may be overvalued and due for a price correction. Conversely, when the price touches or moves outside the lower envelope, it signals an oversold condition, indicating that the asset may be undervalued and due for a price rebound.
Trend Trading with Envelope Indicator
Traders can also use the Envelope Indicator to identify the trend direction. When the price consistently trades above the SMA, it indicates an uptrend, and traders can look for buying opportunities. Conversely, when the price consistently trades below the SMA, it signals a downtrend, and traders can consider selling or shorting opportunities.
Support and Resistance Levels
The upper and lower envelopes can act as potential support and resistance levels. In an uptrend, the lower envelope may serve as a support level, where the price is more likely to bounce back up. In a downtrend, the upper envelope can act as a resistance level, where the price is more likely to reverse and move lower.
Envelope Indicator vs Bollinger Bands
The Envelope Indicator and Bollinger Bands identify potential overbought and oversold conditions and determine trend direction. However, the main difference lies in their calculation method. While the Envelope Indicator uses a fixed percentage deviation from the SMA, Bollinger Bands calculate the deviation using the standard deviation of the price, making them adaptive to changing market conditions. As a result, Bollinger Bands tend to expand and contract with market volatility, while the Envelope Indicator maintains a constant distance from the SMA.
Limitations of the Envelope Indicator
Like any technical analysis tool, the Envelope Indicator has limitations. These include:
- Lagging nature: As a moving average-based indicator, the Envelope Indicator tends to lag behind the current price action, leading to delayed or false signals in fast-moving markets.
- Subjectivity: The choice of parameters for the Envelope Indicator, such as the time frame and the percentage deviation, can vary from trader to trader. This subjectivity may result in different signals and outcomes for different users.
- Ineffective in range-bound markets: The Envelope Indicator is more effective in trending markets and may generate false signals in range-bound or sideways markets.
Tips for Using the Envelope Indicator
- Combine with other indicators: To increase the accuracy of the signals; traders can use the Envelope Indicator in conjunction with other technical analysis tools, such as trendlines, support and resistance levels, or oscillators like the Relative Strength Index (RSI).
- Adjust parameters: Experiment with different time frames and percentage deviations to find the best settings for your trading style and risk tolerance.
- Be mindful of market conditions: The Envelope Indicator is more effective in trending markets. Be cautious when using it in range-bound or volatile markets, as it may generate false signals.
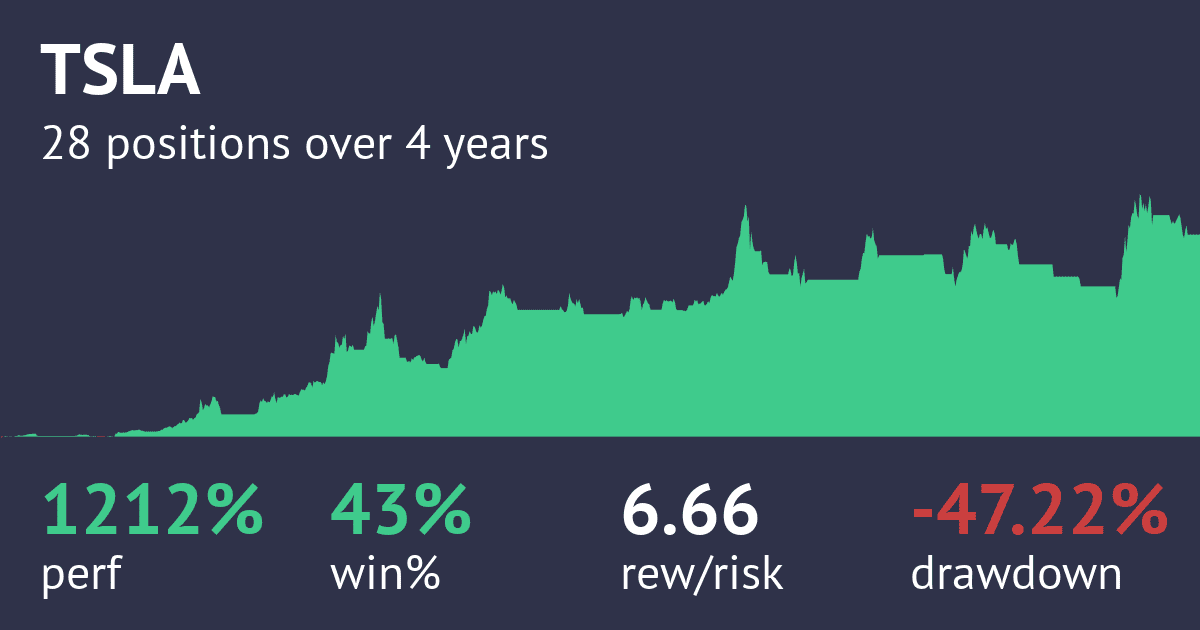
Example strategy based on Envelope Indicator
The Envelope Indicator can be used in Testing Strategies. To see how exactly it can be used in this way, we provide the following sample. The strategy tests buying and selling rules built around this indicator.
The Bottom Line
The Envelope Indicator is a versatile technical analysis tool that helps traders identify overbought and oversold conditions, trend direction, and potential support and resistance levels. While it has limitations, using the Envelope Indicator and other technical analysis tools and adjusting the parameters to suit individual trading styles can improve its effectiveness. Understanding the signals generated by the Envelope Indicator and incorporating them into a well-rounded trading strategy can help traders and investors navigate the financial markets more confidently.


