


Hello, traders, and welcome to another software update from TrendSpider! In this update, we’ve added a powerful new indicator to the platform that those in the ICT community should be interested in: The Order Block indicator by Sonarlab! Details after the jump!
What Are Order Blocks?
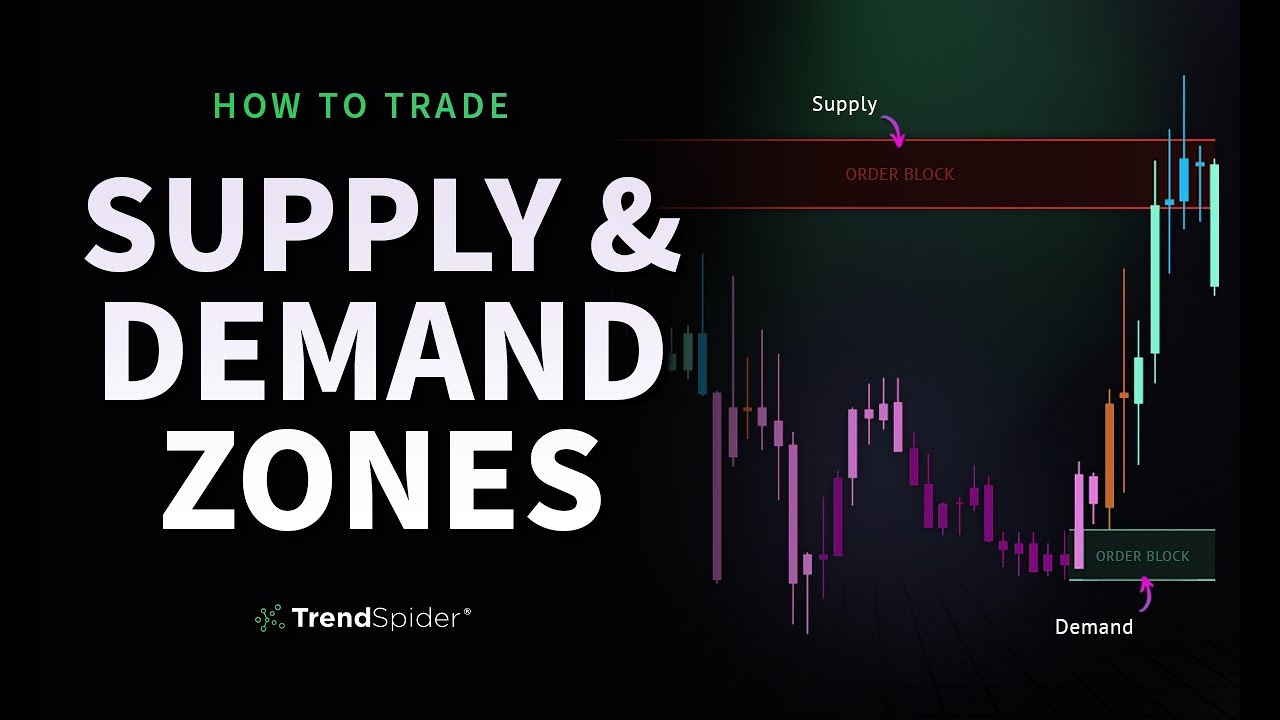
Order blocks represent specific areas within price action in which it is believed that large market participants such as institutional traders, hedge funds, and banks have previously placed significant buy or sell orders. Due to the weight of institutional participation, these areas on the chart can cause a strong reaction in price movements, acting as levels of powerful resistance and support.
Adding The Indicator To Your Chart
In order to add this indicator to your chart, search ‘Order Blocks’ in your indicator list and select ‘Apply’.

Once added to your chart, the indicator will automatically draw any order block levels that meet its preset criteria. All order blocks above the current price will be shaded in blue while all order blocks below the current price will be shaded in green.

Order Block Parameters
When you open the indicator parameters, you’ll notice several editable criteria including ‘Sensitivity’, ‘OB Mitigation Type’, and ‘L’ and ‘S’ color fields. Let’s take a moment to understand what each of these parameters control.

Sensitivity
Sensitivity is used in the crossover/under functions and is a benchmark for the Rate of Change calculation. What this means is that the higher the sensitivity, the more the price needs to change in percentage terms for an order block to be drawn. By default, this value is preset to 28 as that’s what the team at Sonarlab has found to be the most optimal setting. It is recommended, however, that if someone trades using lower timeframes, then a lower sensitivity value should be utilized as the percentage change in price on lower time frames is generally less than over higher time frames. In essence, the higher the time frame, the higher the sensitivity setting should be.
OB Mitigation Type
This setting determines the type of price action that will cause an Order Block to be mitigated, or removed from view. When ‘Close’ is selected, the candle must close through the order block range in order to mitigate it. When ‘Wick’ is chosen, the price must simply wick through the order block range for it to be mitigated.
It’s worth noting that the first test of an order block is generally considered to be the most important, and therefore, most likely to cause a reaction. Subsequent tests are considered less so. This is particularly important in the case when the price has previously wicked through an order block but the ‘Close’ setting is selected.
L/S Fields
These fields allow the user to customize the look of the order blocks that are drawn. The ‘L’ stands for long and represents order blocks that are below where the price is trading currently whereas the ‘S’ stands for short and represents order blocks that are above where the price is currently trading.

As always, we hope you find these updates helpful and, if you have any questions, feel free to reach out to us via the ‘Contact Us’ button in the bottom right-hand corner of your chart view.


