


William J. O’Neil introduced the cup and handle pattern in 1988 in his landmark book How to Make Money in Stocks, and it’s been a cornerstone of trend following ever since. TrendSpider takes the manual work out of finding these setups, automatically detecting cup and handle patterns in real time, scanning the entire market for active formations and breakouts, and letting you layer on any additional criteria you want.
Plans from $32.92/month.
Up to 65% off every plan.
View pricing options Offer ends Sunday, November 22 at 11:59pm CTin bonus tools, free with any plan
4 months of Sidekick Plus + 4 months of SignalStack Pro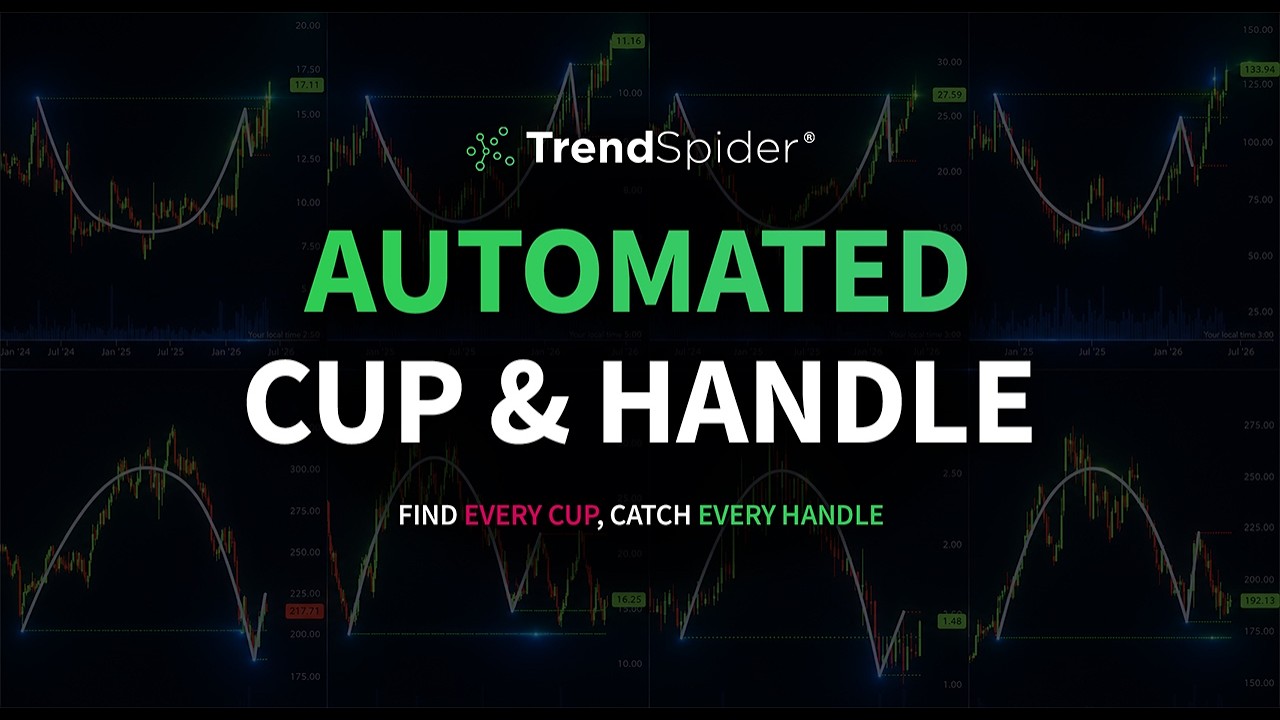
What is the Cup and Handle Chart Pattern?
The cup and handle is a bullish continuation pattern that forms when a stock pulls back in a rounded, U-shaped base (the cup), then consolidates in a tighter range before breaking out to new highs (the handle). The pattern signals that selling pressure has been absorbed and buyers are ready to push higher. For a full breakdown of how to identify and trade it, see our cup and handle pattern guide.
To enable automated detection in TrendSpider, click the three dots next to the Chart Patterns toggle above your chart and turn on Cup and Handle. You can also toggle on additional patterns at the same time, from triangles to wedges, so everything you want auto-detected is running on a single chart.
Once the pattern is active in your indicator list, click the three dots next to it to open the settings. Here you can fine-tune how the detection works:
- Time Span: choose Short Term to prioritize smaller, faster-forming patterns, or Long Term for larger, more developed formations
- Inverted: switches detection to the inverse cup and handle, identifying bearish setups instead of bullish ones
- Retracement: adds Fibonacci retracement levels drawn from key legs of the pattern, such as from the first pivot high down to the bottom of the cup, to help identify potential support and resistance levels within the formation
- Bands: adds bands around the key horizontal levels of the pattern to visualize areas of interest around the cup's pivot levels and the handle's range

When a pattern is detected, TrendSpider draws five structural levels on your chart:
- Handle: the consolidation range before the breakout
- 1st Pivot: the high on the left side of the cup
- 2nd Pivot: the high on the right side of the cup
- Handle End: where the handle concludes and a potential breakout begins
- Cup: the rounded base of the formation
Scanning for Cup and Handle Chart Patterns
Instead of manually flipping through hundreds of charts, TrendSpider's market scanner lets you surface cup and handle setups across any basket of stocks in seconds. You can import the scanners directly from the TrendSpider store or search for them by name inside the Market Scanner. From there, select your universe of stocks, hit scan, and get your results instantly.
There are six scanners in the cup and handle scanner collection:
- Cup and Handle Pattern in Force: flags stocks currently forming an active cup and handle pattern
- Cup and Handle Breakout: catches stocks that have just broken out above the handle's resistance level
- Inverse Cup and Handle Pattern in Force: identifies bearish setups where the pattern is forming upside-down
- Inverse Cup and Handle Breakdown: surfaces stocks that have broken down below the inverted handle
- CANSLIM Cup and Handles in Force: finds stocks that have an active cup and handle pattern plus meet all of the CANSLIM criteria
- CANSLIM Cup and Handle Breakouts: finds stocks that broke out of a cup and handle pattern and meet all of the CANSLIM criteria
The pre-built scanners run on the weekly timeframe, which is one of the most popular intervals for cup and handle formations, but the timeframe is fully adjustable if you prefer to scan on the daily, monthly, or any other interval.
You can also set up a scheduled scan to run automatically before or after the market closes, with results delivered straight to your inbox. That way, you walk into each session with a fresh list of setups already waiting for you.
Customizing the Cup and Handle Scans
The scanners work out of the box, but you can customize them to fit exactly how you trade. The cup and handle scanners are a starting point, not a ceiling. Stack them with any indicator, condition, or fundamental filter available in the platform.
Once you import a scanner, you can clone it to make it your own and layer in any conditions you want. Add an RP > 80 filter to surface patterns only in the strongest names, or go further and add revenue growth, EPS growth, or any other fundamental criteria that fits your process. In the CANSLIM cup and handle scanners above, we combined our CANSLIM scan criteria with the cup and handle criteria, giving you an excellent way to automate William O'Neil's entire strategy.
Using Sidekick AI to Analyze Cup and Handle Patterns
Running the scan gives you a list of candidates. Deciding which ones deserve your attention is where Sidekick AI comes in.
Once you have your scan results, export them to a watchlist and hand it off to Sidekick. From there, ask it to rank the stocks however you want: strongest fundamentals, cleanest technicals, best recent news catalyst on the breakout, or any combination you choose. Sidekick has access to recent news catalysts, earnings data, and key fundamentals, and it can mark levels directly on your chart and run a full deep-dive on any ticker in plain language. It turns a long list of pattern matches into a prioritized shortlist you can actually act on.

Conclusion
The cup and handle earned its reputation over decades of real market performance. TrendSpider lets you put that edge to work systematically, from pattern detection to filtered scans to AI-driven ranking, all without flipping through a single chart. Schedule a scan to run before the bell and start every session with fresh setups already waiting. Try the cup and handle scanners and see what's setting up today.


